LinkedIn Ads
4 LinkedIn Ad Settings Worth Getting Right
LinkedIn Campaign Manager gives you a start date, a budget, and not much else. Here’s what’s missing — and the settings that actually fix delivery inefficiency and wasted spend.
LinkedIn Ads
In B2B advertising, the “who” matters more than “how many.” Yet when you look at LinkedIn’s Campaign Manager, all you see are totals: total impressions, leads, CTR, CPC, CPM, and the list goes on.
Take CTR, for example. Most marketers obsess over it. But according to the ZenABM 2026 LinkedIn ABM Performance Benchmarks Report, which analyzed 161,000+ ads across 211 companies, CTR showed a slightly negative correlation to pipeline (Spearman’s ρ = −0.170). In other words, campaigns with higher CTR did not generate more pipeline.
These metrics look good on average, but without account-level insight, you are likely to spend more on the wrong campaigns. That’s the problem LinkedIn revenue attribution tools solve.
In this article, we will look at the LinkedIn ad metrics that matter, including the ones Campaign Manager does not show.
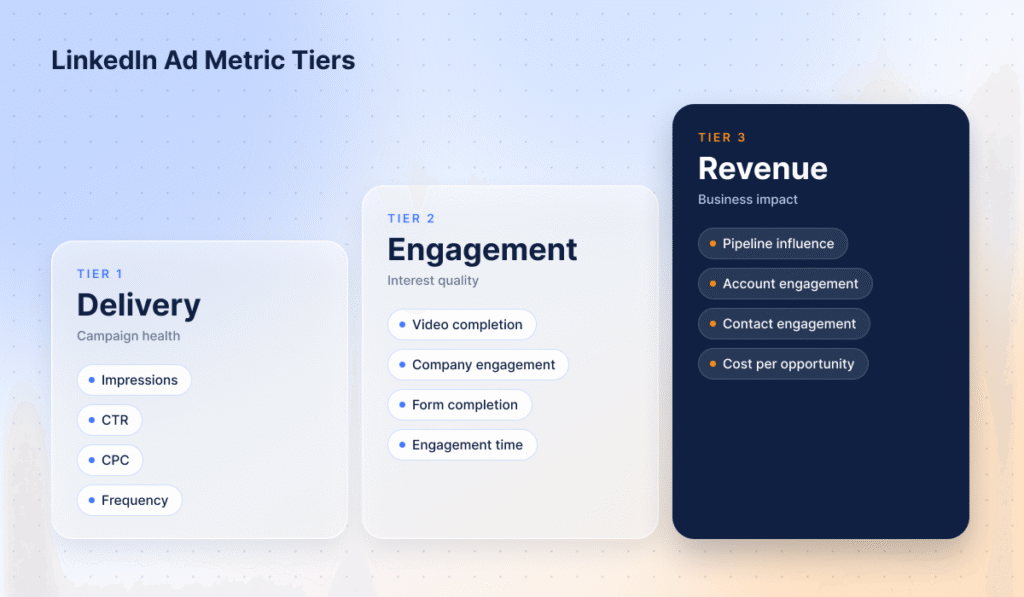
LinkedIn ad metrics fall under three main categories: delivery/campaign metrics, engagement-level metrics, and revenue-level metrics. Most advertisers focus on Tier 1 metrics because they are easier to measure. Here is a summary.
| Metric | What It Measures | What To Watch For | What It Doesn’t Tell You |
|---|---|---|---|
| Impressions | The total number of times people have viewed your ad. It’s a good metric to look out for in awareness campaigns. The more people you reach at this stage, the better. | Delivery pacing: If impressions drop suddenly, you are losing bids. Refresh your ad copy and ensure it is relevant to your target audience. | Attention from the audience: It does not tell you whether a viewer was interested in what you had to say. It only tells you that the ad showed up in someone’s feed. |
| CTR (Click-through rate) | What percentage of people who saw your ad took action. It also indicates how compelling your ad copy is. | Format benchmarks: Always check your CTR against the average expected for each ad format. If yours is below average, your ad is not compelling enough, or it’s not relevant to your audience. | Lead quality: High CTR does not mean more quality leads. Some people click ads out of curiosity, and some may not even be your desired audience. |
| CPC (Cost per click) | The amount you pay for each click. Bidding for lower CPC might be tempting, but it dilutes audience quality. | Bidding signals: A high CPC indicates that your audience might be too narrow, there is high competition for your target audience, or you have a poor relevancy score. | Buyer intent: A low CPC is useless if the clicks come from people who have no intention of buying from you. |
| Frequency | The number of times a person sees your ad over a period of time. | Ad fatigue: If CTR starts declining and CPC starts climbing after the same audience has seen your ad 3 to 5 times, that’s fatigue setting in. Refresh the creative or set a frequency cap. | Whether the repeated ad exposure builds trust or causes frustration. |
These are the basic metrics you can use to manage campaign health. But you should not use them to judge the success of campaigns. When evaluating success, focus on conversion tracking and pipeline growth.
Between strict browser privacy features and the complex B2B buyer’s journey, conversion tracking is hard. The Insight Tag can identify the job titles, industries, or even locations of your website visitors, but it often gets blocked by browser restrictions. This means most of your visitors stay anonymous.
Also, LinkedIn can only track conversions that happen within the set conversion window. The default is 90 days for click-through conversions. Since the average B2B customer journey runs 211 days from first touch to closed-won, according to Dreamdata’s 2025 benchmarks, many conversions happen outside the window and go unnoticed. LinkedIn revenue attribution tools like DemandSense track deal influence across longer windows, connecting LinkedIn ad exposure to pipeline even when deals close months later.
Let’s look at the challenges in more detail.
LinkedIn also provides engagement data. Most people don’t pay attention to these metrics, even though they are more reliable than delivery metrics. They include:
The metrics above make little sense in isolation. But when you bring them together, you get a better understanding of where your campaign is headed and what needs adjustment. Take a look.
| If You See | It Usually Means | What To Do |
|---|---|---|
| High CTR + low conversion rate | There’s a mismatch between the ad and the landing page. | Work on your landing page. |
| High CPC + high company engagement rate | Expensive audience, but the right accounts are paying attention. | Maintain spend and ensure the landing page is just as good as the ad to lock them in. |
| Low CPC + low company engagement rate | LinkedIn is finding cheap clicks from people who aren’t your target buyers. | Tighten targeting and remove audience expansion. |
| High frequency + low CTR | Audience fatigue. | Refresh creative and set a frequency cap. |
| High company engagement rate + low CTR | The audience is right, but the ad has a poor-fit offer. | Keep targeting and test new creative angles. |
| High lead form open rate + low completion rate | The ad is getting attention, but the offer or form isn’t convincing people to finish. | Simplify the form, improve the offer, and ensure the landing experience matches the ad. |
In this section, we will look at the metrics you can’t find in Campaign Manager, even though they are the most important ones. These metrics help you connect LinkedIn campaigns to your pipeline and finally see the whole picture. They include:
With the right revenue attribution tools, you can build these metrics for all your campaigns across marketing channels. Focus more on these revenue-level metrics instead of obsessing over delivery metrics. They might be harder to build, but they are worth it.
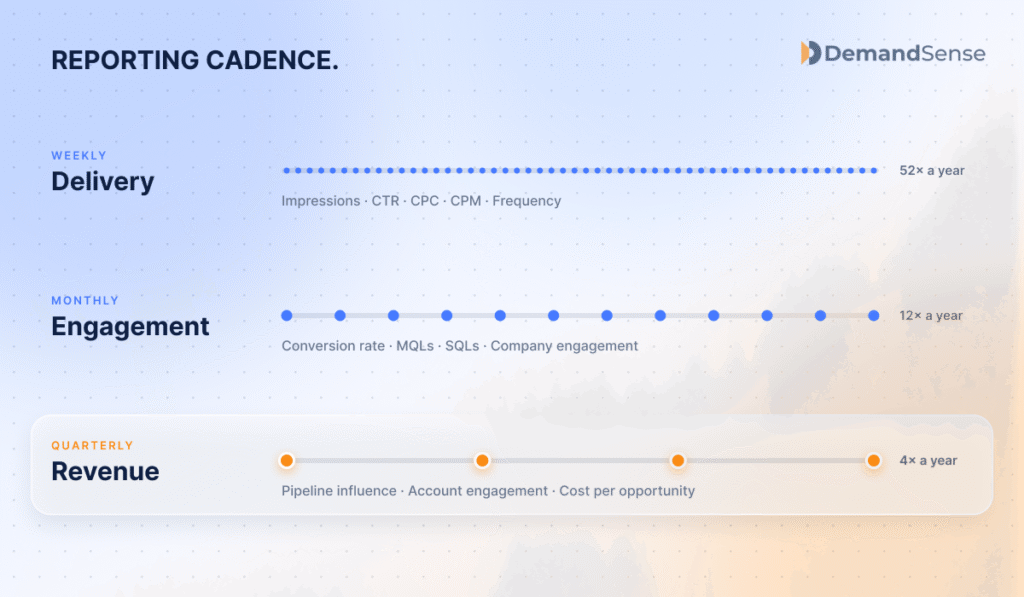
Here is a table of the metrics to focus on at each stage of your campaigns.
| Cadence | Metrics | What You’re Looking For |
|---|---|---|
| Weekly | Delivery: CPC, CTR, CPM, frequency, impressions | These tell you whether your ads are being distributed well. Check for fatigue, relevancy score, and reach. Adjust as you go. |
| Monthly | Engagement: conversion rate, MQLs, SQLs, company engagement rates | Are the right companies engaging? Are leads progressing from interest to sales conversations? If you have high engagement rates but low SQLs, review your offer, qualification criteria, or landing experience. |
| Quarterly | Revenue: pipeline influence, account-level engagement, cost per pipeline opportunity | Which campaigns influenced opportunities and revenue? Shift budget toward campaigns reaching accounts that progress through the pipeline. |
Most people conclude LinkedIn does not work because they focus on the wrong metrics. CTR, CPC, and impressions can help you manage campaign health, but they cannot tell you whether your campaigns are reaching the right accounts or creating real business opportunities.
It’s all about influencing the right people and getting them to move further toward a sale. Use delivery metrics to manage campaign health, engagement metrics to understand interest levels, and revenue metrics to measure business impact. With the right revenue attribution tool, you can connect all three categories and finally see the whole picture.
Book a personalized demo and discover how we can transform your B2B marketing.
See a quick demo videoLinkedIn Ads
LinkedIn Campaign Manager gives you a start date, a budget, and not much else. Here’s what’s missing — and the settings that actually fix delivery inefficiency and wasted spend.
Revenue Attribution & Measurement
Learn what account-based intelligence is, how it works, and how B2B teams use it to identify in-market accounts and drive revenue.
LinkedIn Ads
Revenue Attribution & Measurement
Discover 10 proven tactics to improve your LinkedIn ad performance, from funnel optimization and creative testing to closing attribution gaps that hide real ROI.
Get expert insights and strategies delivered to your inbox weekly.
