LinkedIn Ads
LinkedIn Matched Audiences: Why They Underperform and How to Fix Them
LinkedIn Matched Audiences often match less than you expect. How match rates work, why lists stall under 300, and what to fix before you launch.
LinkedIn Ads
If you search for the “average cost per lead for LinkedIn ads” on Google right now, you will get different articles that quote different numbers ranging from $15 to $350. And if you compare your CPL with these numbers, one article might say your campaigns are performing extremely well, while another might say you are paying too much for your leads.
The problem is not that CPL varies; it’s that these benchmark reports don’t tell you where their numbers come from.
We analyzed data from 100+ B2B advertisers across SaaS, IT, and professional services and found the average CPL to be $221.14 for external landing page conversions and $810.83 for native LinkedIn Lead Gen Forms.
In this article, we will walk you through how to calculate cost per lead for LinkedIn ads, how to benchmark your CPL correctly, and what you can do to lower your CPL on LinkedIn and still generate more quality leads through your LinkedIn ads.
According to DemandSense’s 2026 LinkedIn B2B Benchmark Report, the average cost per lead on LinkedIn is $221.14 for external landing pages and $810.83 for native Lead Gen Forms, across SaaS, IT and professional services clients.
Here’s what you need to know about CPL in a nutshell:
CPL = Total Ad Spend ÷ Number of Leads
For example: you spent $5,000 on your LinkedIn ads and generated 23 leads.
$5,000 ÷ 23 = CPL $217.39
You can also calculate CPL from CPC and conversion rate:
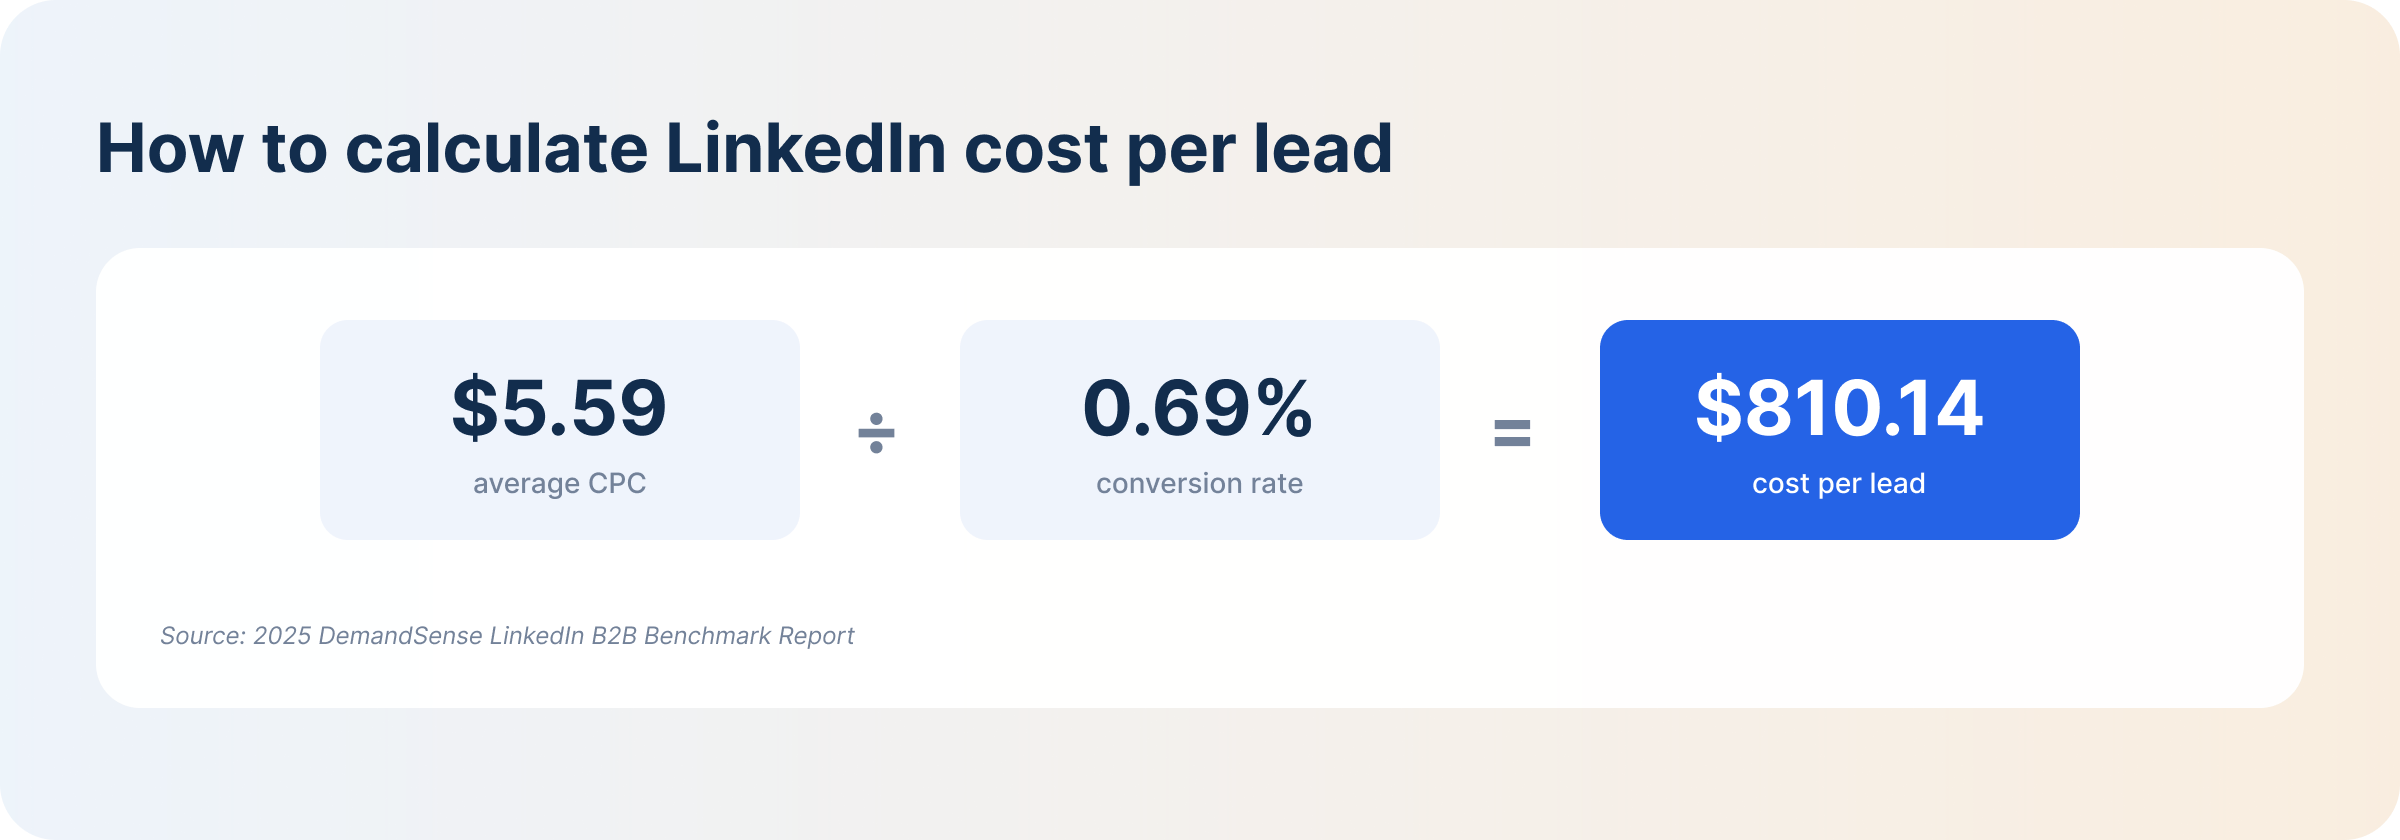
CPL = CPC ÷ Conversion Rate
Using our own benchmark figures, where the average CPC for LinkedIn ads is $5.59 and the conversion rate is 0.69%:
$5.59 ÷ 0.69% = CPL $810.14
This means a change in your conversion rate automatically impacts your CPL — if the conversion rate increases, your CPL decreases, and vice versa.
Keep in mind that leads are different, which is why the average CPL varies from article to article. To calculate CPL correctly, segment leads and calculate CPL separately for form fills vs. MQLs and SQLs. And when comparing your CPL with competitors, ensure it is for the same type of leads — we’ll look at how to benchmark CPL correctly in the later sections.
CPL only tells you how much you spend on leads. It doesn’t tell you whether you paid for quality leads, or whether the leads convert into customers and how much revenue they bring. If you optimize campaigns to lower CPL, you might end up wasting your ad spend on the wrong people.
For example, a $150 CPL producing leads sales won’t touch is more expensive than a $600 CPL producing three opportunities — and accounts usually kill the wrong one. You may never realize this unless your CRM and LinkedIn ads data are connected.
Look at the following pipeline-level metrics too before optimizing campaigns:
Judging your campaigns using CPL alone is like judging lead generation campaigns on form completion rate. According to our data, the average Lead Gen Form open rate is 2.99% and the completion rate is 23.1% — much higher than the landing page conversion rate, which is why many marketers switch to Lead Gen Forms to drive more conversions and lower CPL.
However, the form gets more conversions because LinkedIn auto-fills it, making it easy for users to submit — sometimes people outside your ICP who may never buy from you.
The average cost per lead on LinkedIn varies because the platform runs on an auction system, and the amount you spend depends on your ad relevancy score, bid strategy and level of competition for your audience. Let’s look at each factor in detail:
The more specific your targeting is, the higher your cost per click — but in return, you will pay less for a qualified lead compared to targeting a broad audience.
Competition is always high for niche audiences, especially for high-value segments like B2B SaaS and financial services. You have to pay a premium to outbid the competition, but the results are worth it.
Extremely narrow audience lists, like those for ABM campaigns, make CPL statistically unstable because a handful of conversions can move the numbers dramatically. This is why you should build custom audiences using your own company list to ensure your ABM campaigns only reach your desired audience.
Awareness campaigns cost less than lead generation campaigns because TOFU campaigns don’t need the audience to take any high-intent actions. Even if you target the same audience across campaigns, the CPL increases as they move down the funnel.
Bid strategy also influences CPL. LinkedIn has three bidding options:
Choosing manual bidding over automatic bidding gives you more control over how your ad budget is spent and can help you lower LinkedIn advertising costs — as long as the bid strategy fits your campaign goals.
If your ads have clear messaging that resonates with your target audience, they are more likely to click, driving your CTR and conversion rate up. This lowers CPC and eventually CPL — without lowering lead quality — because LinkedIn rewards relevant messaging with lower ad costs.
The average CTR for LinkedIn ads is 0.52% across B2B SaaS, IT and professional services, based on 2026 LinkedIn ads benchmarks. A number above this does not automatically mean your campaigns are performing well, and a lower CTR isn’t always bad. This is why you should not optimize campaigns for CTR or CPL alone without checking pipeline-level metrics.
LinkedIn ads often reach a smaller, more niche audience than Google ads, so ad fatigue kicks in faster. Your audience starts to ignore your ads, CTR and conversion rate drop, LinkedIn increases your CPC, and CPL spikes.
Treat a rising frequency paired with a declining CTR and rising CPL as a creative refresh signal. Revisiting LinkedIn ad creative best practices can help you find fresh angles for your creatives instead of starting from scratch.
During the first week of a new campaign, frequency and performance fluctuate because there isn’t enough data yet — give the numbers time to stabilize before looking for patterns.
CPL benchmarks will always vary because the reports are written from different sample compositions, date ranges and lead types. A benchmark without its methodology attached is close to useless.
The DemandSense 2026 Benchmark Report contains aggregates across SaaS, IT and professional services. The aggregates should help you gauge your performance against peers, but they still lack your unique business context.
Here’s what you need to know before comparing CPL:
| What Varies | Why It Changes CPL | What To Check Before Comparing |
|---|---|---|
| Lead definition | “Leads” mean different things for different accounts | Does the lead definition in the benchmark report match yours? |
| Campaign objective | Campaigns that require high-intent actions like demo requests cost more than “Learn more” campaigns | Is the benchmark for lead generation, website conversions, or another objective? |
| Funnel stage | CPL increases as the audience progresses down the sales funnel | Are the campaign offers the same as yours? |
| Ad format | Different formats have different levels of friction, audience engagement and CTR, which influences the final cost of acquiring a lead | Did the report analyze the same ad formats you used for your campaigns? |
| Industry and deal size | Enterprise deals cost more than mid-market and startups | Industry, audience, deal size, and sales cycle |
| Date range | Ads are more expensive during Q4 than Q1 | When was the study conducted and when was it published? |
When comparing CPL:
1. Compare campaigns with similar goals. Retargeting vs. cold prospecting isn’t a fair comparison, and neither is a gated report vs. a demo request.
2. Measure qualified leads instead of all leads. A low CPL means nothing if you are only paying for low-quality leads. Cost per qualified lead helps you make that distinction.
3. Compare your performance over time. Your own trailing CPL beats any industry average because the denominators are consistent.
A low CPL might make it seem like you are spending less on campaigns, but if you only reach leads that don’t convert, you will lose money eventually. Do these instead:
Choosing the cheapest ad format does not automatically lower your CPL — the right choice depends on what you want to achieve and the warmth of your target audience.
For example, Lead Gen Forms drive more conversions by making it easier for prospects to fill out forms without leaving the platform, but they lower your lead quality.
Using document ads gives users the same frictionless experience because they can read the documents on LinkedIn without leaving the platform, and you still get quality leads. They are good for nurturing the audience and building trust.
Single image ads are more versatile and can fit into any funnel stage — use them to create brand awareness and send prospects to your landing page. Since most users scroll LinkedIn on their phones, favor mobile-first formats, and test different formats to find the ones that work for your audience.
LinkedIn gives you the freedom to narrow your targeting to the exact accounts that you want. Keeping your targeting tight can increase your raw CPL, but it also lowers your cost per opportunity — the high CPL eventually pays off.
Just ensure you are reaching the right accounts. Instead of relying on LinkedIn’s broad filters, build custom ICP-fit audiences through LinkedIn Matched Audiences: upload your account and contact lists, then layer in job title, seniority and industry to reach key decision-makers in every account. A warm audience is cheaper to convert.
Excluding existing customers, closed-lost accounts and competitors from your target lists also ensures your ad budget does not go to waste on accounts that have already converted or never will.
Prospects are more likely to click on your ads or convert if the copy addresses specific pain points they are struggling with.
The creative and landing page offer should also match. If the ad promises a benchmark report but the landing page asks them to book a sales call, you’ve created friction.
Work on the following:
Reducing the number of required fields does not mean you should keep your forms basic. It’s better to add specific fields that filter out prospects with low buying intent than to reduce friction and get submissions from the wrong audience. If the form is too long, divide it into sections that are easy to complete.
Native LinkedIn Lead Gen Forms bring in more conversions because the forms are easy to fill out and users don’t have to leave the platform. They also sometimes bring low-quality leads because they remove friction. The average open rate is 2.99% and the submission rate is 23.1%, which looks good next to the landing page’s 0.69% conversion rate. But our findings say otherwise:
| Approach | CPL | What You Gain | What You Give Up | When to Use It |
|---|---|---|---|---|
| LinkedIn’s native Lead Gen Form | $810.83 | Low friction for your users because the forms are auto-filled from their profile data | Lead quality and website traffic | High-volume top-of-funnel content offers like webinar signups and e-book downloads |
| External landing page | $221.14 | You can identify a buyer’s intent based on the pages they visit and expose them more to your brand | High friction lowers lead volume and conversion rate | High-intent offers like live product demo requests, free trials |
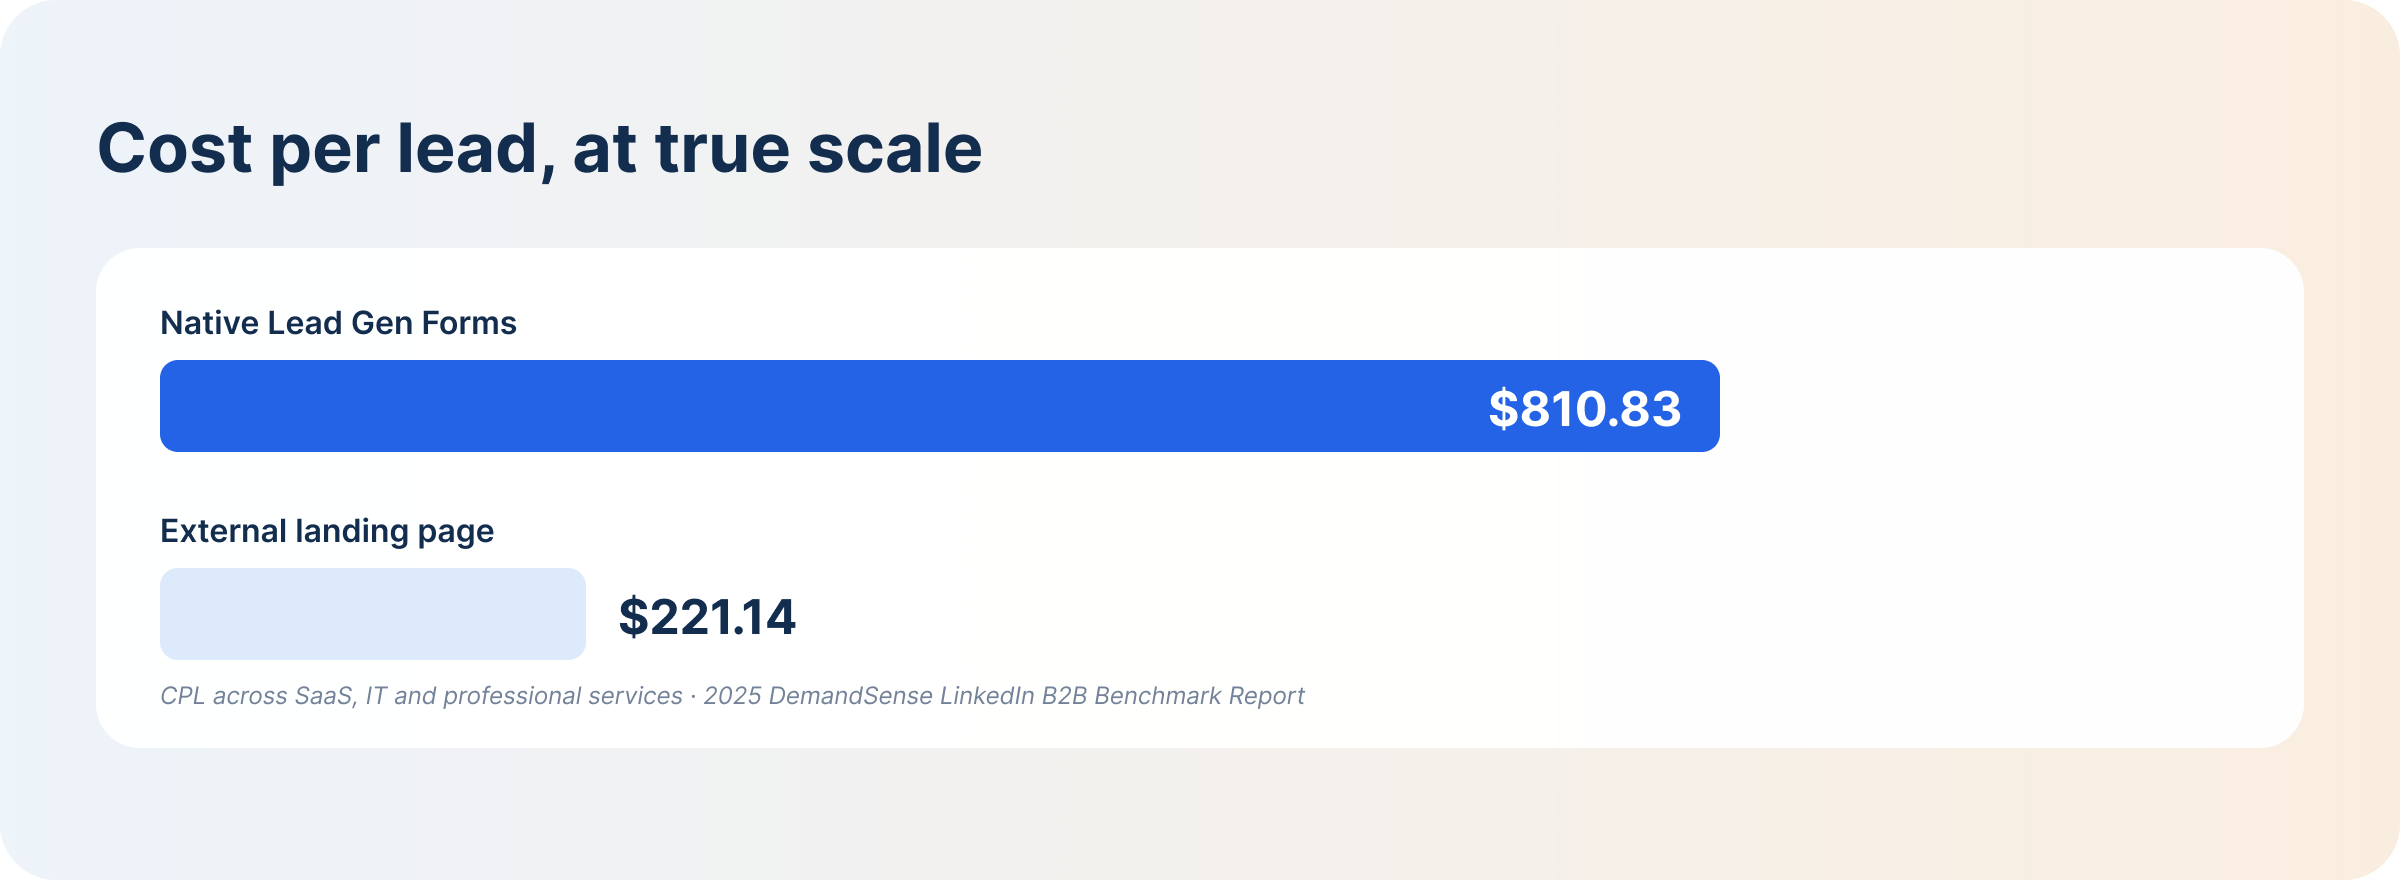
Lead Gen Forms drive conversions, but their CPL is far more expensive than the landing page’s. This does not mean they are entirely bad for campaigns — they are still useful for mobile-heavy audiences and for teams with no landing page capacity. Choose between the two depending on what you hope to achieve: more leads, or more qualified leads.
Your CPL can be high or low because of several factors, so before you make any campaign decisions:
1. Segment before you judge. Cold prospecting campaigns perform differently than ABM campaigns. Group campaigns by audience, funnel stage, offer, ad format and conversion path.
2. Check if the sample is big enough. The amount spent, the number of clicks and how long the campaigns have been running tell you if they are ready for optimization. Small campaigns need more time before the numbers stabilize.
3. Look at the trend, not the snapshot. Compare similar past campaigns with your current campaign to see the trends.
4. Read CPL against lead quality. Are the leads growing into pipeline opportunities? If CPL drops and the number of sales-qualified leads also drops, the campaign has not improved at all.
5. Decide what to change. The table below tells you what to look out for, what each situation means and what to do next.
| What You’re Seeing | Most Likely Cause | What to Check First | What Not to Do |
|---|---|---|---|
| CPL rising with frequency | Creative fatigue | CTR and CPC. If CTR is declining while CPC is increasing, it’s time for a creative refresh | Expand your targeting |
| CPL rising + stable frequency | Increased competitor auction bids | Your bidding strategy. Switch to cost-cap bidding to keep up with competitors without overspending | Assume the creatives are not working |
| CPL falling + lead quality falling | The algorithm is showing your ads to low-intent users | The companies and people engaging with your ads; tighten targeting to ICP-fit audiences only | Celebrate the low CPL and scale the budget |
| CPL low but pipeline flat | Leads aren’t converting to opportunities | Friction in your follow-up strategy, and sales feedback on lead quality | Blame the ad creatives — sometimes quality leads fall off because of the post-click experience or poor follow-ups |
| CPL high and pipeline healthy | You’re reaching high-intent buyers where competition is stiff | Cost per opportunity, won ROAS, revenue. Allocate more budget here | Optimize campaigns to lower CPL |
Marketers already expect to pay more for LinkedIn ads than Meta or Google ads because of LinkedIn’s professional audience. So the question is not “How can I lower my CPL?” but rather “How can I get more value from my advertising spend?”
A cheap campaign can produce nothing, while an expensive one carries the quarter — and Campaign Manager alone can’t tell you which is which.
DemandSense connects your LinkedIn ads data to your CRM for pipeline attribution, so you can see which campaigns generate leads and which influence your pipeline.
Its revenue attribution brings both your organic and paid LinkedIn activity into one view, giving you insight into ad influence on pipeline and revenue. You get to define for yourself what qualifies as “influenced” through three attribution presets — Awareness, Engagement, Intent.
The pipeline and revenue metrics — influenced pipeline (the opportunities your campaigns influenced) and closed-won revenue (the value of the closed deals they touched) — help you see how high CPLs convert into high-value deals, making it easier to justify ad spend. And with Spend Protection, your budget stops going to accounts that have already closed.
The evidence arrives before the deal does. Buyer engagement is visible in weeks, so you bring it to the budget conversation while the campaign is still running. And when deals do close, DemandSense sends them back: closed-won deals with their value, and qualified opportunities as qualified-lead events, go from your CRM to LinkedIn through the Conversions API on a daily sync, so the campaign can optimise on cost per qualified lead rather than cost per form fill.
Try DemandSense on your own campaigns, free for 30 days — no card needed.
Yes — the CPL might be higher than other platforms, but that’s because of LinkedIn ads’ targeting precision and the high competition for the professional audience. When you look at the cost per opportunity, you realize that LinkedIn delivers high-quality leads that progress through the sales funnel faster. This is better than paying for cheap leads that sales will reject.
Your campaigns should run long enough to clear the learning period and accumulate a meaningful number of conversions — on B2B budgets, it takes weeks, not days, especially when your target audience is small.
In the first week of a new campaign, the numbers fluctuate as the algorithm gathers data, and a small change in conversions can spike your CPL. Give your campaigns enough time to stabilize.
A high CPL is profitable if the deal size is also large. Divide your CPL by your lead-to-conversion rate and compare it to your Customer Lifetime Value (LTV). If your CPL is high but the leads bring in six-figure deals, then the campaign is worth it.
No — sometimes it signals low lead quality. Many marketers expand their targeting in an attempt to halve their CPL and end up with more low-quality leads that don’t convert into pipeline.
To be sure about campaign performance, measure CPL alongside cost per opportunity, cost per qualified lead, cost per meeting, and influenced pipeline. These tell you whether your ads are attracting the right leads or not.
The average CPL for LinkedIn ads is $221.14 for landing pages and $810.83 for native LinkedIn Lead Gen Forms across B2B SaaS, IT and professional services.
But “good” depends on several things: your campaign objective, target audience, level of competition, lead definition and deal size — a $200 CPL is expensive for a $5k product and cheap for a $200k one.
Industry averages help you gauge how your campaigns perform against peers, but benchmarking your current campaigns against your own past campaign data gives you a more reliable CPL signal, because the denominators are consistent.
You can start with Campaign Manager; however, it only tracks CPL from conversions it can see through the Insight Tag or native Lead Gen Forms. It cannot track leads that convert later, arrive through a channel LinkedIn can’t claim, or become opportunities weeks after the click.
LinkedIn can also take conversions synced from your CRM through its Conversions API, which DemandSense connects for you: closed-won deals and qualified opportunities go back on a daily sync. To trace the buyer’s journey from start to finish and capture the leads that arrive after the campaign window closes, you also need revenue attribution connected to your CRM.
Book a personalized demo and discover how we can transform your B2B marketing.
See a quick demo videoLinkedIn Ads
LinkedIn Matched Audiences often match less than you expect. How match rates work, why lists stall under 300, and what to fix before you launch.
LinkedIn Ads
A complete guide to LinkedIn targeting: every ad targeting option, retargeting and matched audiences, ABM targeting, and how to keep audiences converting.
LinkedIn Ads
Compare LinkedIn Conversation Ads and Message Ads: how each format works, which fits your campaign, and how to measure them beyond opens and clicks.
Get expert insights and strategies delivered to your inbox weekly.
