••
Insights & Resources
Expert strategies, case studies, and best practices for B2B marketing teams.
Expert strategies, case studies, and best practices for B2B marketing teams.
Ask Claude anything about your LinkedIn Ads, website visitors and CRM deals. DemandSense MCP
Private early access
LinkedIn Ads
LinkedIn ad costs shift constantly as competition, targeting, and bidding change. The only way to know whether your campaign performance is healthy or whether something needs attention is to compare it against industry benchmarks.
This article covers 2026 LinkedIn ad benchmarks by industry, ad format, and campaign objective, plus the metrics B2B marketers should watch. Benchmarks are a starting point, though — revenue, pipeline, and ROAS tell you more about a campaign’s real impact than any platform metric alone.
LinkedIn Ads benchmarks are standardized performance metrics — CTR (click-through rate), CPM (cost per mille), and CPC (cost per click) among them — that marketers use to evaluate campaign performance against peers. Performance varies by industry, and ad format affects cost too. But with these metrics, it’s easy to tell whether your ad spend is in a normal range or whether a campaign needs optimization.
| Metric | What It Measures | Why It Matters | When To Optimize |
|---|---|---|---|
| CTR (click-through rate) | The percentage of people who clicked your ad. | Shows how relevant your message is to your target audience — a high CTR tends to bring CPC down, and vice versa. | CTR is below average and costs keep rising. Don’t optimize on CTR alone. |
| CPC (cost per click) | The amount you pay for each click. | Shows how much you’re spending to reach potential buyers. | Costs keep climbing, but conversion rate is low and no new opportunities are entering the pipeline. |
| CPM (cost per mille) | The amount you pay per 1,000 impressions. | Helps you gauge reach — an important metric for TOFU (top-of-funnel) campaigns. | CPM rises with no improvement in engagement or reach. |
| CPL (cost per lead) | How much it costs to acquire a lead. | Justifies your ad spend. | Lead quality declines, or CPL exceeds your target acquisition cost. |
| Conversion rate | The percentage of clicks that turn into website conversions — a specific completed action on your site. | Helps you diagnose weak points in the campaign, whether that’s the messaging or the landing page experience. | Traffic is strong and consistent, but bounce rate stays above 60%. |
| Engagement rate | How many people interact with your content relative to how many see it. | Higher engagement rates tend to bring better reach and higher conversion rates. | New creative stops attracting attention — time for creative testing. |
| ROAS (return on ad spend) | Revenue generated for every dollar spent on ad campaigns. | Helps you prove LinkedIn ROI. | Once you’ve identified high-performing campaigns, shift budget toward them to maximize ROAS. |
| Pipeline influence | The number of sales opportunities influenced by LinkedIn ads. | Measures LinkedIn’s contribution to revenue — especially in long B2B sales cycles where buyers take time before converting. | Ads bring in leads, but few convert into pipeline opportunities. |
Early-signal metrics like CTR, CPM, and impressions tell you whether the ads are working, but not whether you’re reaching your ICP (ideal customer profile) or how campaigns influence pipeline. A campaign can beat every benchmark in this table and still fail if none of those clicks come from a real buying committee or turn into opportunities. To judge a campaign’s success, weigh pipeline influence, closed-won deals, and ROAS alongside the benchmarks above — they’re what actually prove business impact.
 Free tool
A benchmark tells you where you sit against the category average. The Analyzer shows you who is setting it: enter your website and it finds the advertisers active in your niche — including ones you had not listed. Pick up to two and a side-by-side breakdown of their messaging, offers and creative lands in your inbox in about 30 minutes.
Compare my categoryNo ad account access. No credit card.
No single metric tells the whole story. A high CPC isn’t always bad if your ads are reaching the right people, and a low CPM isn’t always good — if you’re reaching the wrong audience, that “cheap” CPM is still wasted spend in the long run. The only way to understand how a campaign is really performing is to look at all three metrics together.
CTR and CPM together determine your CPC. Here’s how to read the combination — call it the CTR-CPM quadrant:
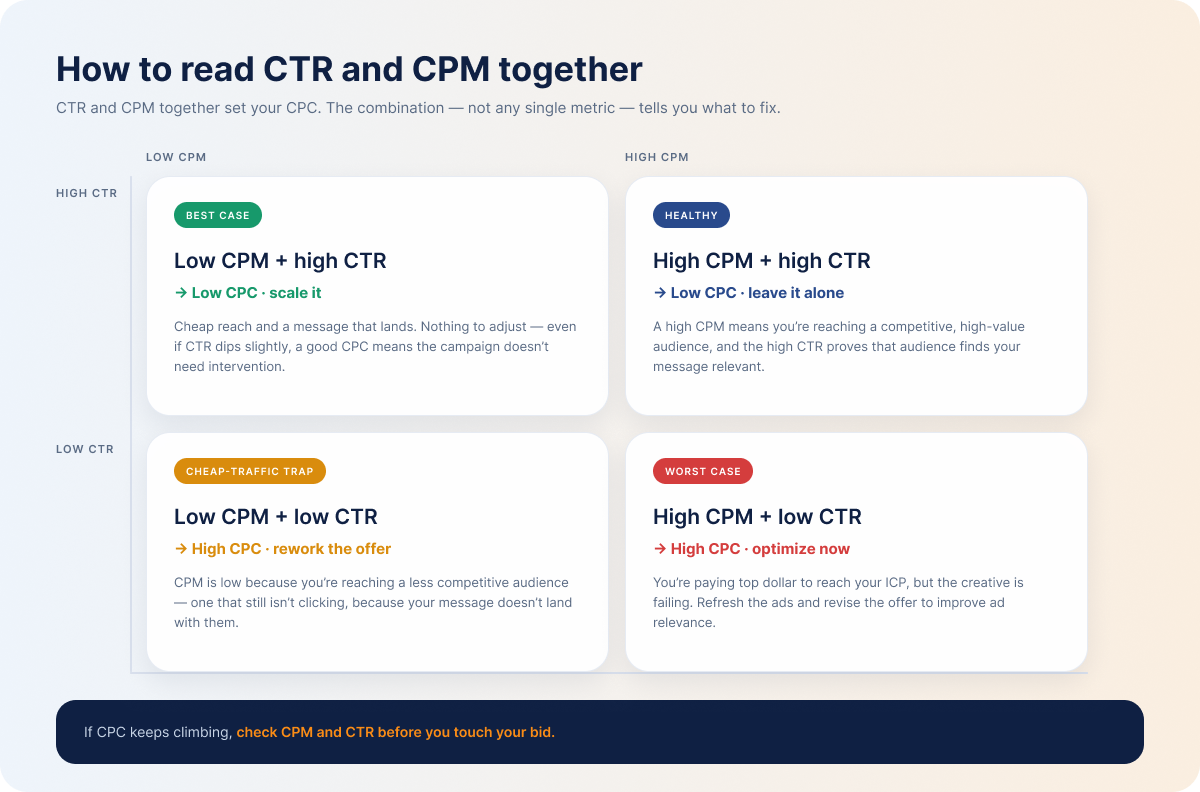
If CPC keeps climbing, check CPM and CTR before you touch your bid.
LinkedIn ad costs vary widely across industries. Targeting B2B SaaS or financial services costs more than targeting a broader sector like education, because LinkedIn runs on an auction system: cost depends on your audience, how much competition exists for it, and how valuable those customers are.
A few factors drive most of the difference:
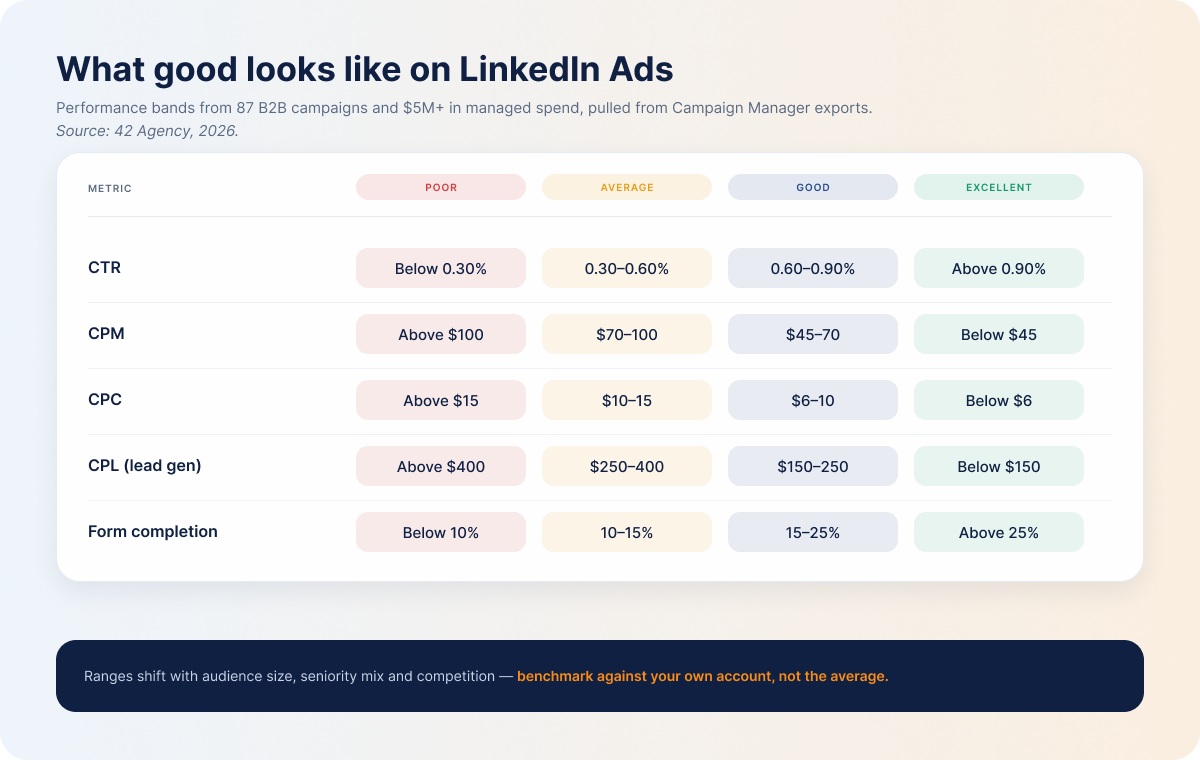
Before the sector-by-sector view, it helps to have a general yardstick. 42 Agency’s LinkedIn Ads rating scale — built from 87 B2B campaigns and more than $5M in managed spend, pulled from Campaign Manager exports rather than surveys — sets out what good looks like across the platform:
| Metric | Poor | Average | Good | Excellent |
|---|---|---|---|---|
| CTR | Below 0.30% | 0.30–0.60% | 0.60–0.90% | Above 0.90% |
| CPM | Above $100 | $70–100 | $45–70 | Below $45 |
| CPC | Above $15 | $10–15 | $6–10 | Below $6 |
| CPL (lead gen) | Above $400 | $250–400 | $150–250 | Below $150 |
| Form completion rate | Below 10% | 10–15% | 15–25% | Above 25% |
Those bands hold across B2B as a whole. Where your own campaigns land inside them, though, depends heavily on which sector you’re selling into — competition for the audience, how much intent it carries, how long the sales cycle runs, and how big the deal is at the end of it. Here’s how the five compare:
This category, everything from HR tech and IT services to enterprise SaaS platforms, is highly competitive, and the audience is skeptical, which is why CTR runs lower than most other sectors. CPM and CPL are high because of that competition, but the ROI on the deals you close is worth the expense, especially against an enterprise ICP. This audience responds better to low-commitment offers: free trials, demos, webinars.
Financial services is one of the most expensive audiences to acquire, thanks to a small audience size and high customer lifetime value. Marketers are willing to pay a premium to reach them.
Costs stay lower here because of a larger audience size. To build engagement with firms offering professional services — consultancies, agencies, accounting and legal firms — target them with content that demonstrates expertise: thought leader ads, case studies, educational content.
Healthcare and MedTech audiences are expensive to reach because of small audience size and strict compliance requirements. They also have a longer buying cycle and need retargeting across multiple touchpoints before converting. High-value contracts offset the high ad costs.
Education and professional training is the least expensive sector, thanks to a broad audience — plenty of professionals are actively looking to build new skills. As long as your offer is clear and relevant, expect strong engagement. Costs climb, though, once you start targeting executives within the sector.
Benchmarks make it easy to compare your LinkedIn ad costs and performance to industry peers, but they can mislead you without context. Don’t optimize purely to the benchmark — your business runs under its own constraints and goals. Focus instead on your own marketing and sales process: what actually qualifies as an MQL (marketing-qualified lead) or SQL (sales-qualified lead) for your business, and whether your campaigns are reaching the decision-makers at your target accounts, not just anonymous visitors who never convert.
Four reasons industry benchmarks can mislead:
To see a campaign’s true impact on business outcomes, connect your LinkedIn ad performance data to your CRM data.
Knowing how your ads compare to other advertisers shows you where to improve — but CTR, CPC, CPM, and CPL only tell part of the story. Weigh them against ad format, campaign objective, lead quality, CRM data, pipeline influence, and revenue impact before you decide what to scale, cut, or investigate further.
Every ad format performs differently. Here’s what to track for each one:
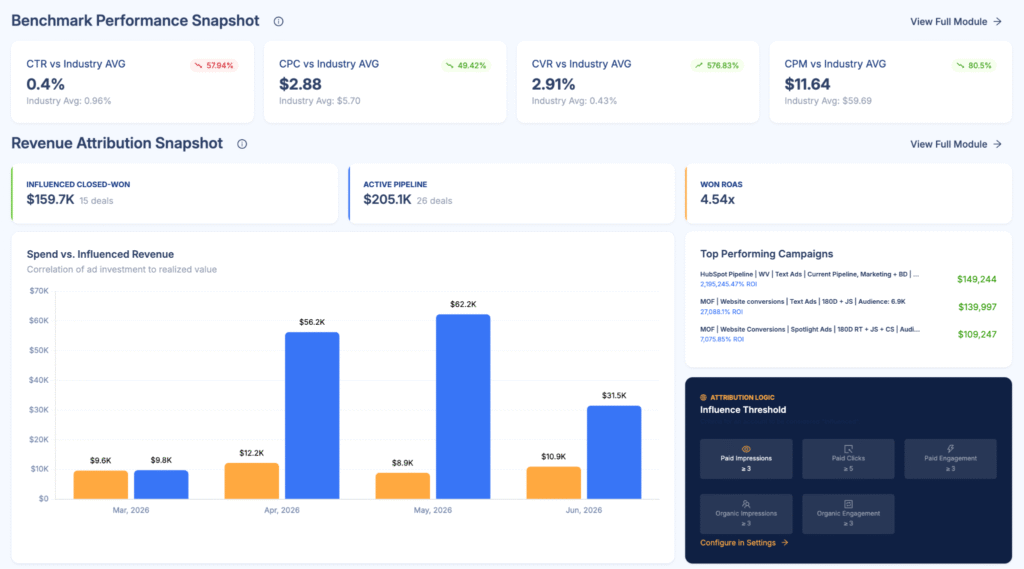
LinkedIn Campaign Manager gives you campaign metrics: impressions, CTR, CPM, CPC. What it can’t tell you is how those campaigns influence pipeline and revenue, because it has no connection to your CRM.
DemandSense’s LinkedIn ads analytics and CRM integration close that gap — connecting Campaign Manager to HubSpot or Salesforce so you can see not just how campaigns are performing, but how they influence active pipeline.
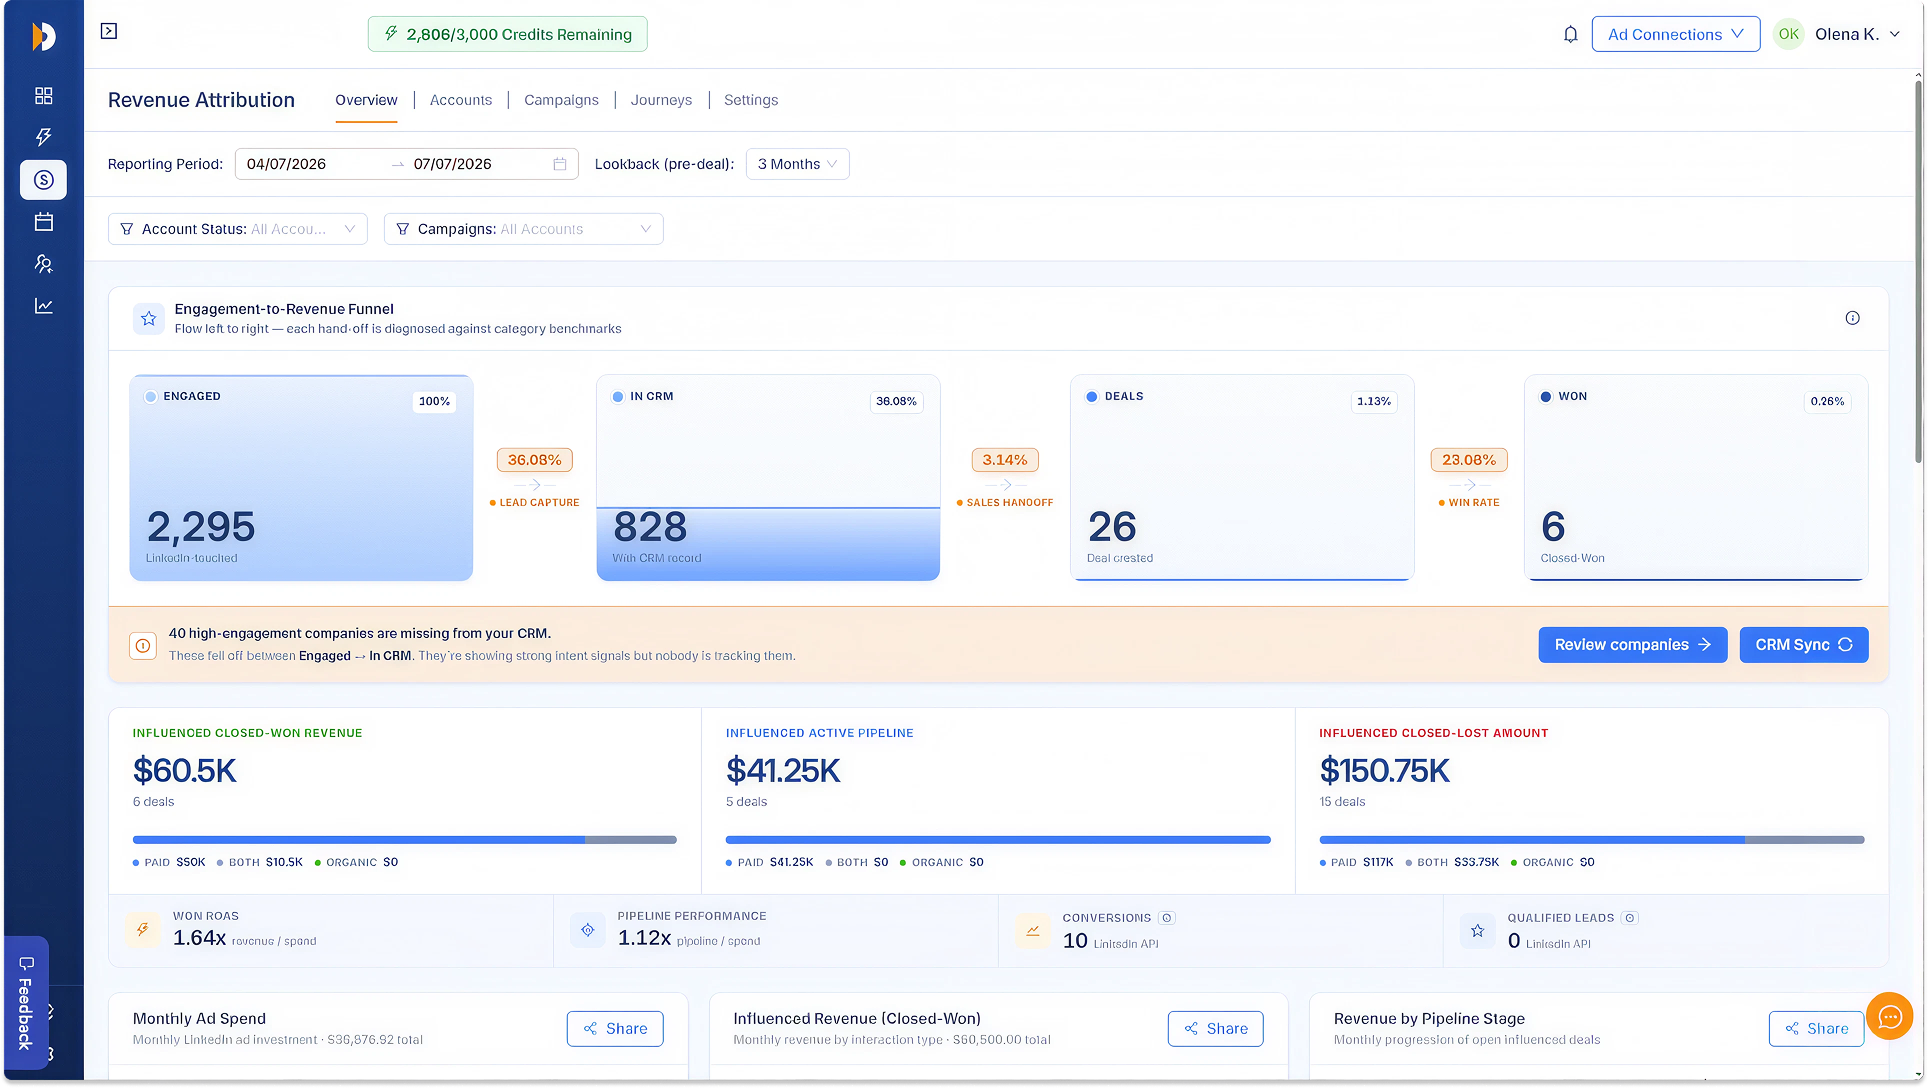
Inside DemandSense’s Revenue Attribution module, you can see:
DemandSense customers using these controls average 0.875% CTR, well above LinkedIn’s roughly 0.52% platform benchmark — a real gap, built from real client campaigns rather than a hypothetical.
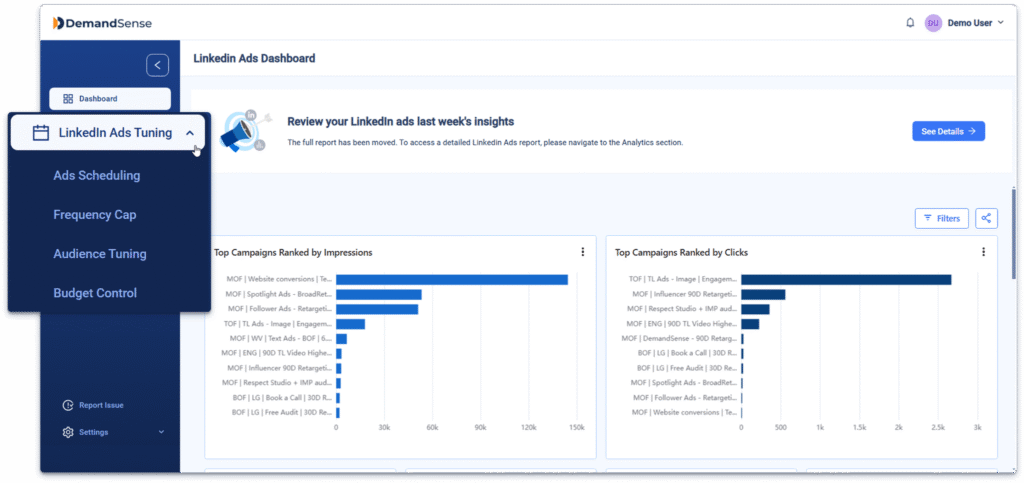
On top of attribution, you get delivery controls Campaign Manager doesn’t offer natively: ad scheduling and budget control, frequency caps, and audience tuning — the budget optimization and bidding strategy work that keeps campaigns reaching your ICP without wasted spend.
A good CTR for LinkedIn Ads is 0.60% and above for Sponsored Content. The broader platform average runs 0.44–0.65%, with LinkedIn’s median CTR benchmark sitting closer to 0.52% — though this varies by ad format, geography, and target audience.
The average CPC for LinkedIn Ads runs around $5.59 across the B2B accounts in our 2025 LinkedIn B2B Benchmark Report, though this shifts by ad format, location, and target audience. Job titles and seniority matter more than almost anything else: C-suite and senior decision-makers can cost $15 or more per click, while junior job titles cost less.
A good CPM for LinkedIn Ads is one at or below the typical range for your sector, not a single platform-wide number. Published 2026 estimates span roughly $25–$60 per 1,000 impressions, and the industry ranges above put most B2B sectors between $40 and $120 — so judge your CPM against your own industry. A niche audience, or a target list weighted toward senior job titles, will push it higher.
LinkedIn Ads cost more than ads on other platforms because of its professional audience. Unlike Meta or Google, where marketers target broad consumer audiences, LinkedIn lets you filter down to exactly the decision-makers you want — mid-market ICP or enterprise ICP, by job titles, seniority, and industries — and that precision drives up competition. You pay more to reach your audience, but you get higher-quality leads in return.
It depends on the funnel stage and audience size. Targeting a niche audience usually means a higher CPL, thanks to stiffer competition — and bidding lower to compensate can pull in lower-quality leads.
For CTR, TOFU (top-of-funnel) campaigns should aim high: a high CTR signals broader reach and a message that’s resonating. But a high CTR is far less impressive when the clicks come from the wrong people. Always check multiple metrics before adjusting a campaign.
Because LinkedIn runs on an auction system, sectors with high-value contracts — finance, healthcare, tech, and similar B2B SaaS categories — cost more due to stiffer competition. Broader sectors with less competition, like education or manufacturing, cost less.
Start by connecting LinkedIn Campaign Manager to your CRM. From there, you can see the entire buyer’s journey — from ad click to MQL, SQL, opportunity, and closed-won deal — plus business-outcome metrics like pipeline influence, cost per opportunity, and revenue attribution. That’s what shows you campaign impact on pipeline and revenue, beyond clicks and impressions. If you’d rather ask than dig, DemandSense’s AI Co-Pilot answers questions like “how does my CTR compare to my industry benchmark” directly, in plain English.
ROAS (return on ad spend), LTV (lifetime value), CPA (cost per acquisition), conversion rate, and engagement metrics like video completion rate matter most. Together, they tell you whether a campaign is actually working or just burning the budget.
Get expert insights and strategies delivered to your inbox weekly.
Book a personalized demo and discover how we can transform your B2B marketing.
See a quick demo video
AI Copilot
LinkedIn Ads
Learn what B2B teams should automate in LinkedIn Ads with AI, what decisions should stay human, and how AI-powered campaign management helps improve spend, targeting, and revenue impact.
Tools & Comparisons
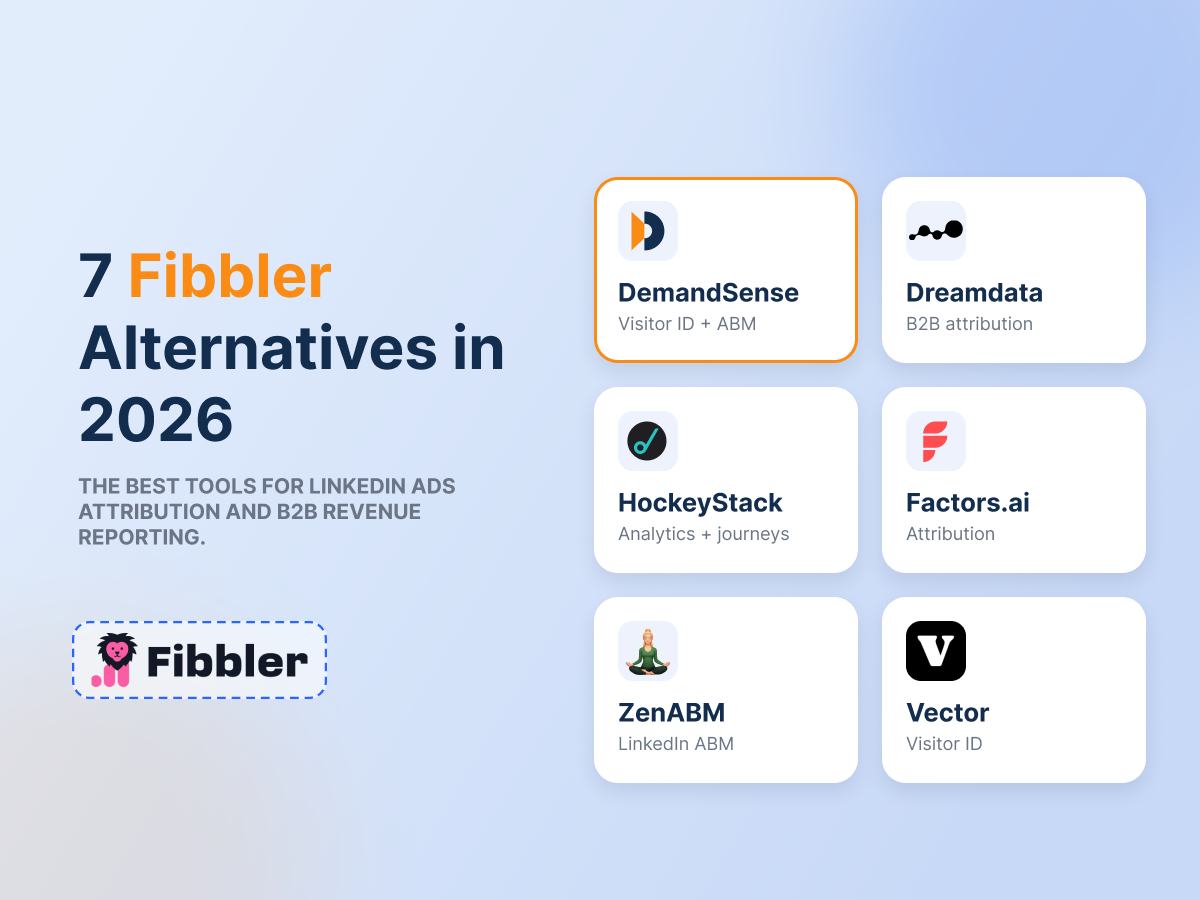
Looking for a Fibbler alternative? Compare tools for LinkedIn Ads analytics, attribution, wasted spend reduction, CRM pipeline tracking, and paid media performance.
LinkedIn Ads
LinkedIn Campaign Manager gives you a start date, a budget, and not much else. Here’s what’s missing — and the settings that actually fix delivery inefficiency and wasted spend.