••
Insights & Resources
Expert strategies, case studies, and best practices for B2B marketing teams.
Expert strategies, case studies, and best practices for B2B marketing teams.
LinkedIn ads cost more per click than Meta or Google ads. In return you get a professional audience you can narrow by job title, job function, seniority and industry, and for most B2B teams that is a fair trade. The harder question is whether you are paying more than you need to.
We analyzed data from 100+ B2B advertisers across SaaS, IT and professional services to show how much LinkedIn ads cost in 2026 and how to lower your costs without lowering lead quality.
These are the numbers the rest of the article works from:
LinkedIn has no price list. Ad space is sold through an auction, so what you pay depends on who else wants the same audience.
Every time a member in your target audience is about to see an ad, the advertisers targeting that member compete for the slot. LinkedIn weighs each bid together with a relevance score, which reflects how likely members are to engage with the ad, so a more relevant ad can win against a higher bid.
It is a second-price auction. The winner pays just enough to beat the next advertiser, which is usually less than the maximum bid.
What you are charged for depends on the ad format and how you bid:
| Pricing model | What you pay for | When to use it |
|---|---|---|
| CPC (cost per click) | Each click on your ad | Website traffic and engagement campaigns |
| CPM (cost per mille) | Every 1,000 impressions | Awareness campaigns that need to reach new prospects |
| CPS (cost per send) | Each message delivered to a member’s inbox | Sponsored Messaging (Message Ads and Conversation Ads) |
The CPC and CPL figures below come from our LinkedIn B2B benchmark report. CTR and the wider set of LinkedIn ads benchmarks have their own breakdown.
The average LinkedIn CPC is $5.59. The spread around it is wide: 75% of advertisers in our data pay more than $6 per click and only 12.5% pay less than $3, so the average LinkedIn CPC understates what most advertisers pay.
Whether that is expensive depends on what the clicks return. Dreamdata’s 2026 benchmark report puts LinkedIn’s return on ad spend at 121% for 2025, against 67% for Google Search and 51% for Meta.
With CPM billing you pay for every thousand impressions, whether or not anyone clicks. It suits awareness campaigns and cold audiences, where reach is the goal. At the LinkedIn benchmark CTR of 0.52%, a thousand impressions bring about five clicks.
Our report has no CPM figure. Dreamdata’s puts the average LinkedIn CPM at €34.33 for 2025, up from €26.62 the year before.
The usual advice is that native Lead Gen Forms are the cheaper way to collect leads, because the form opens inside LinkedIn and is pre-filled from the member’s profile. In our report the average form open rate is 2.99% and the completion rate is 23.1%, which looks strong.
The cost per lead points the other way:
A pre-filled form is also easy to submit for people outside your ICP, so check lead quality before you read a high completion rate as a win.
Message Ads and Conversation Ads are billed on a cost per send basis. LinkedIn charges when the message is delivered to a member’s inbox, even if the member ignores or deletes it. Neither LinkedIn nor our data gives an average cost per send, so the only reliable number is the one in your own account. In the EEA and Switzerland these ads reach only members who opted in.
Treat all of these averages as reference points. A cost above average is fine if the leads turn into revenue.
Four things move the price you pay in the auction:
Sponsored Content in the feed costs the most, because nearly every B2B advertiser competes for that inventory. Text and Dynamic ads are cheaper because they run in the right rail, where fewer advertisers compete. Their low engagement is a result of the placement and is not what makes them cheap.
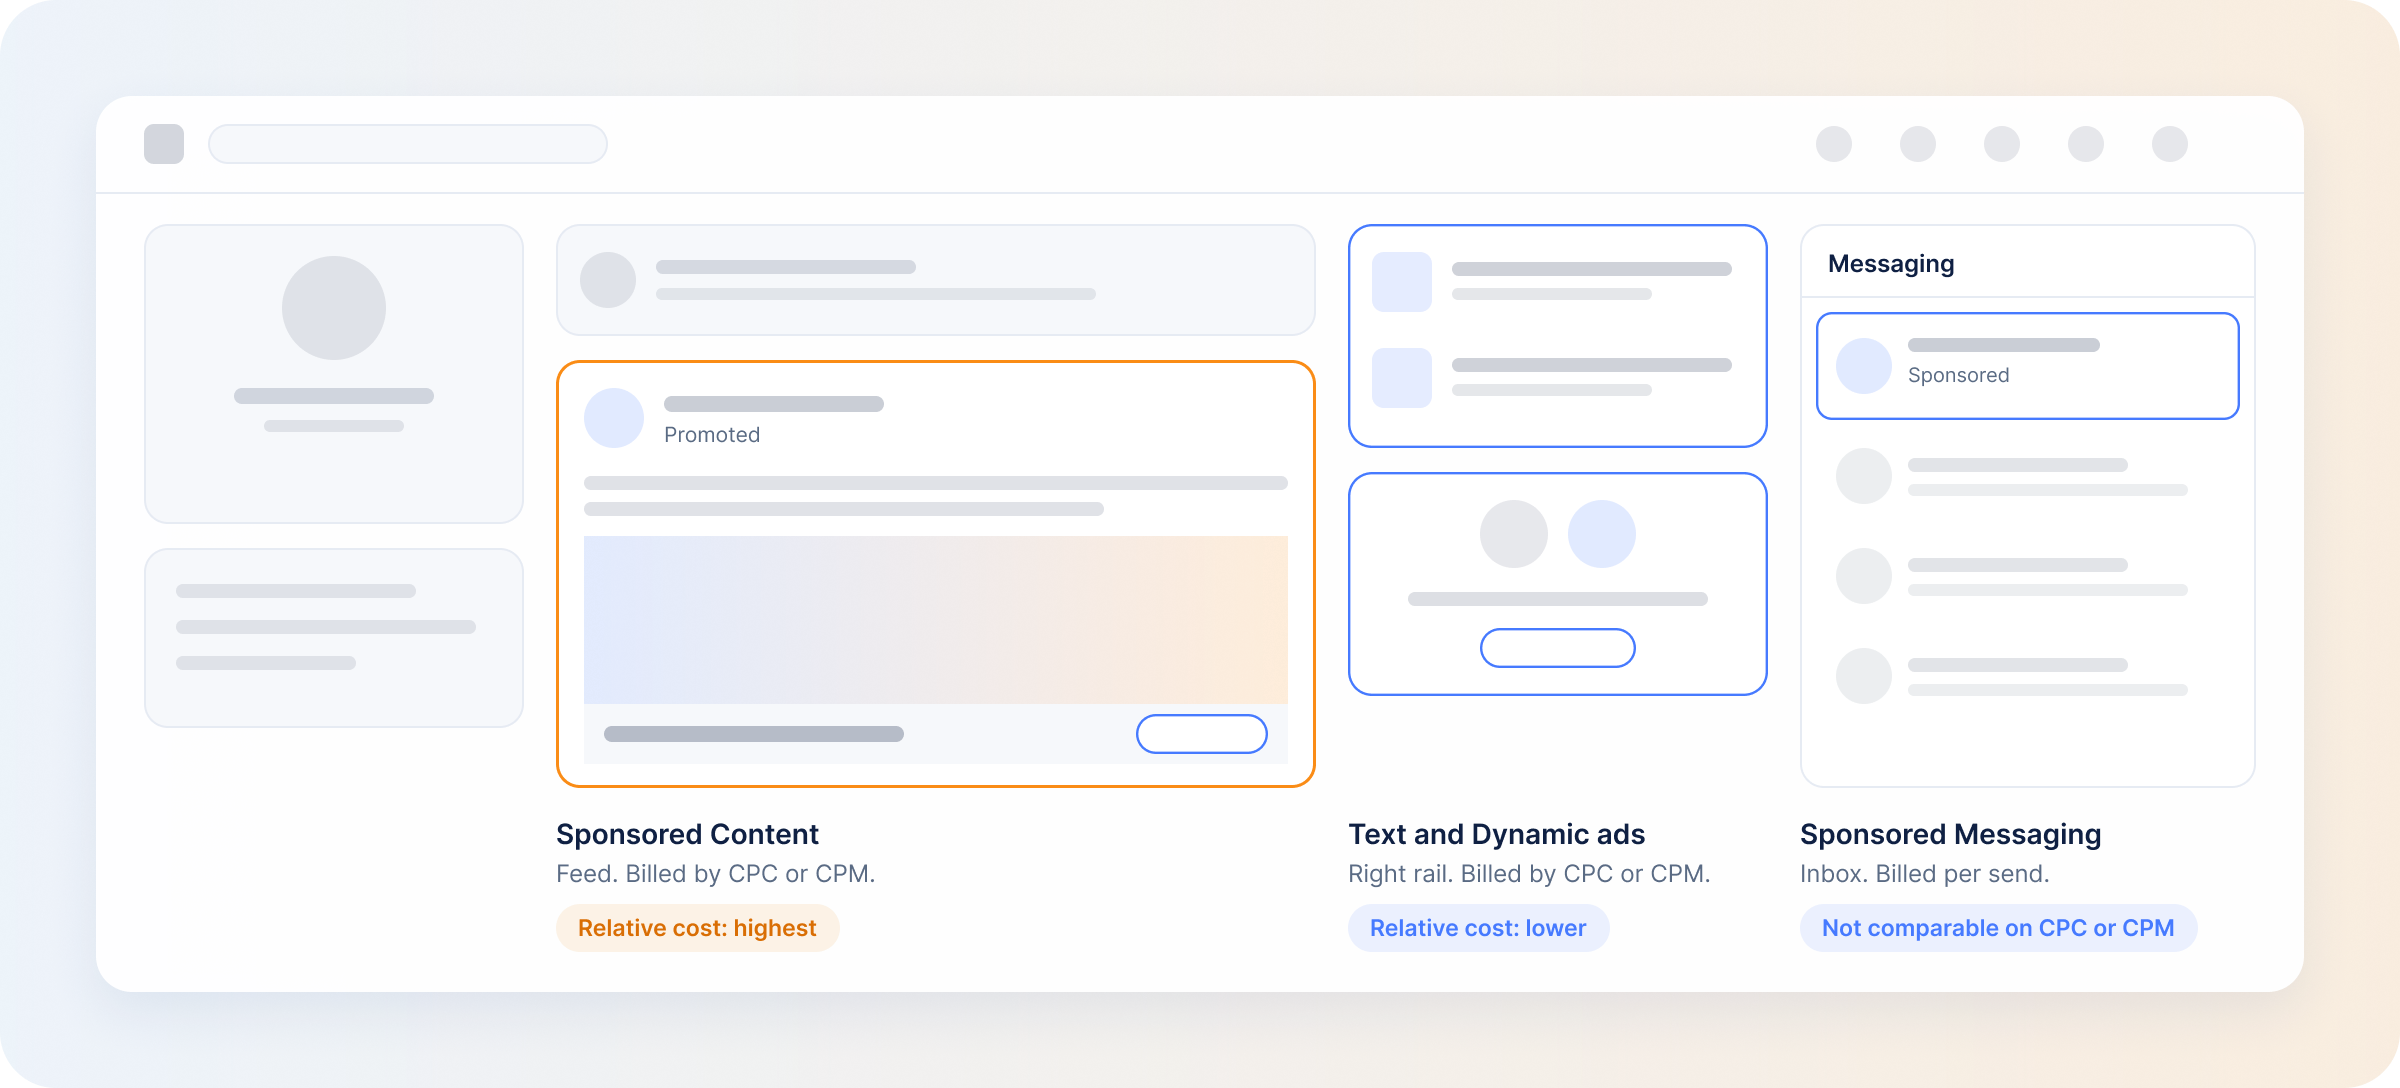
| Ad format | Billing model | Relative cost |
|---|---|---|
| Sponsored Content (single image ads, video, carousel, document ads) | CPC or CPM | Highest |
| Text and Dynamic ads | CPC or CPM | Lower |
| Sponsored Messaging (Message Ads, Conversation Ads) | CPS | Paid per send, so not comparable on CPC or CPM |
A Lead Gen Form is not a format with its own price. It attaches to a Sponsored Content or Sponsored Messaging ad, and you pay for that ad’s clicks, impressions or sends.
The objective tells LinkedIn what to optimize for, and that changes what you end up paying for:
Our report doesn’t split costs by industry, so there is no table here. Industries where one customer is worth a lot, such as financial services, healthcare technology and B2B SaaS, attract higher bids, because advertisers can afford to pay more for each lead. Senior audiences carry a premium for a similar reason: there are only so many decision-makers, and everyone wants to reach them.
So comparing your costs with another company’s tells you little unless you share a target audience, an offer and a deal size.
LinkedIn requires a minimum spend before a campaign can run, set out on its advertising pricing page.
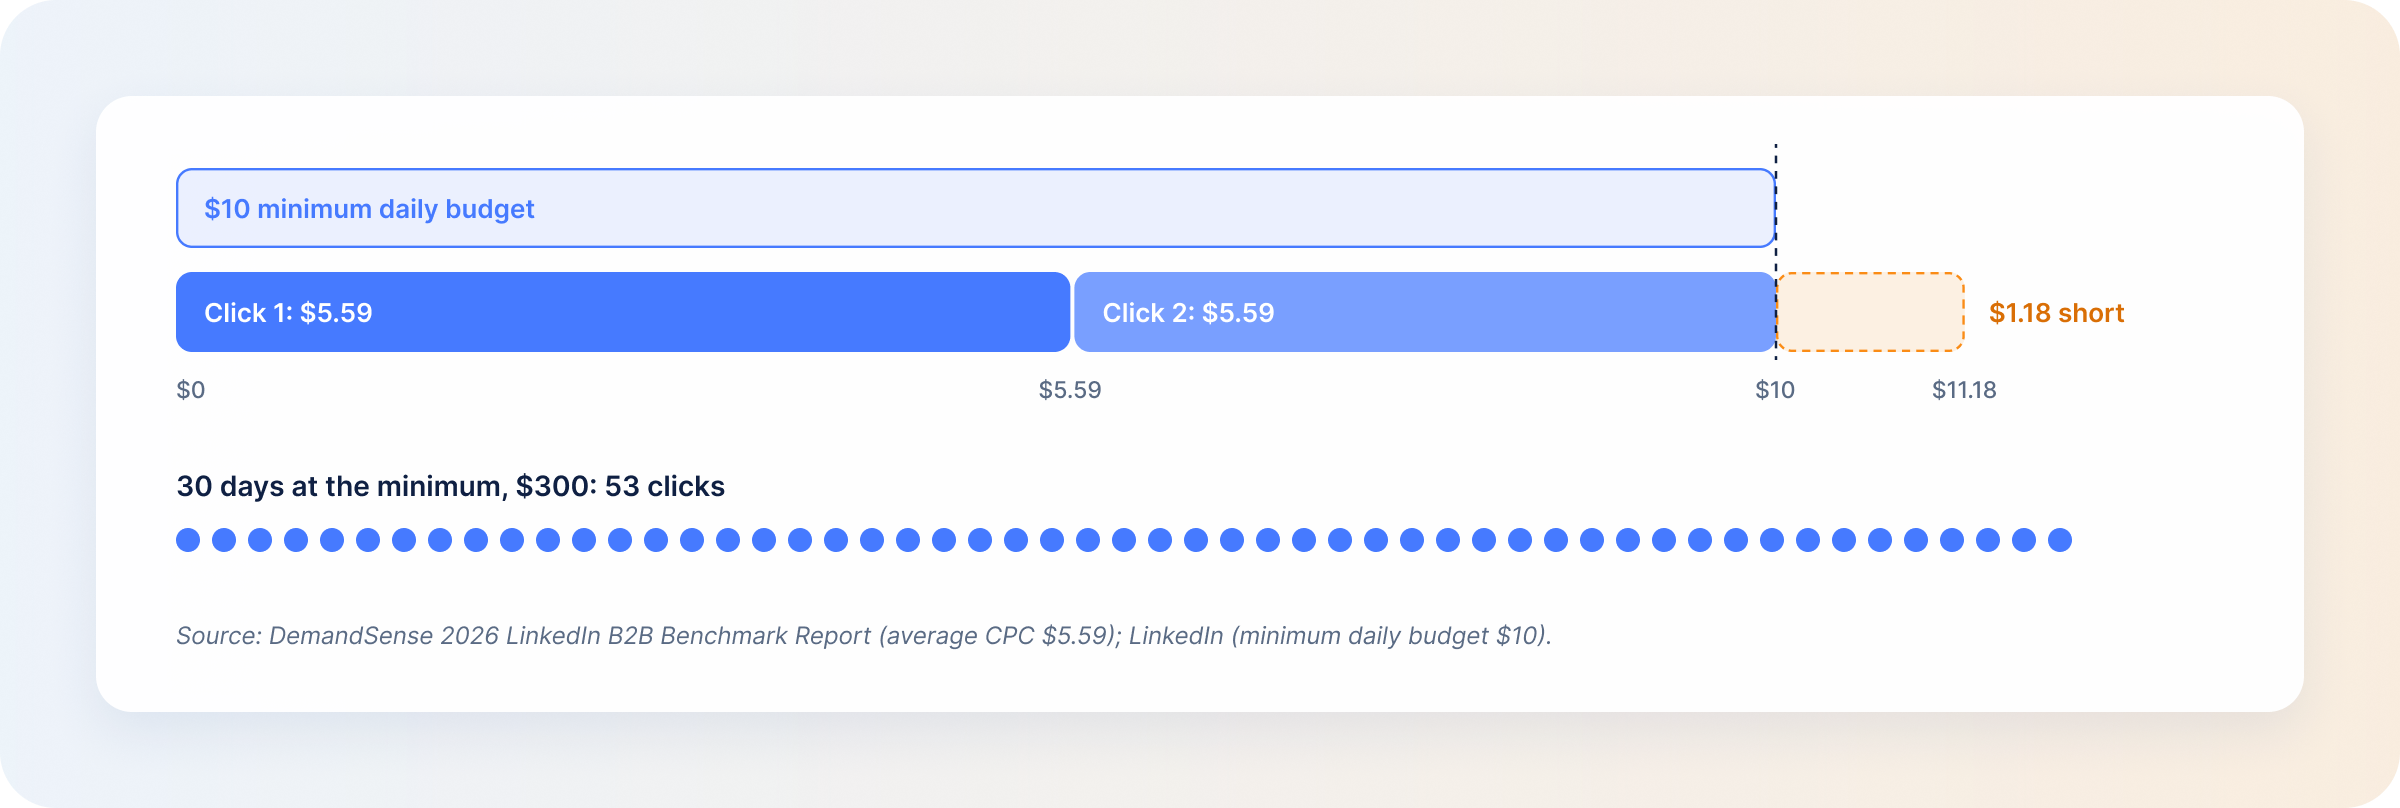
The minimum daily budget is $10 per campaign, for any ad format. You can run a daily budget continuously or with an end date.
A lifetime budget is the total a campaign can spend over its schedule. LinkedIn requires a minimum of $100 for a new campaign.
Not really. At the average CPC of $5.59, $10 a day buys one or two clicks. Over a month that is about 53 clicks at best, which is too few to tell a good audience from a bad one. The minimum is enough to switch a campaign on, and that is about all.
A LinkedIn ads budget is easier to defend when it starts from the revenue you need and works backwards:
Set part of the budget aside for testing audiences and creative before you commit the rest.
A daily budget fits always-on campaigns, and a lifetime budget fits campaigns with fixed dates, such as an event push. You can also set both, so a daily limit applies and the campaign ends once the total is spent.
For bidding, each option trades cost control against delivery:
A common sequence is to start on maximum delivery, see what a result costs, and then move to manual or cost cap bidding.
Broadening the target audience is the quickest way to lower your CPC, and it usually lowers lead quality with it. These six changes reduce LinkedIn ad costs without that trade:
Campaign Manager has no schedule by hour and no monthly cap, so the last few items mean watching dashboards and adjusting campaigns by hand.
DemandSense adds the LinkedIn ad settings that keep your budget on the accounts you want to reach:
Revenue attribution then shows what the spend produced. With your CRM connected (HubSpot, Salesforce or Attio), you see influenced pipeline and Won ROAS, so the question of whether LinkedIn is worth the cost gets answered from won deals.
Try DemandSense on your own campaigns, free for 30 days — no card needed.
There is no fixed timeline. The auction needs data before delivery settles, and B2B sales cycles mean pipeline shows up weeks or months after the clicks. Judge early performance on delivery and engagement, and the campaign on pipeline.
It depends on your deal size and sales cycle, so there is no single good number. Measure ROAS on revenue from won deals (Won ROAS), not on form submissions. A campaign that looks expensive per lead can still return well.
There is no percentage that works for every company. It depends on how much of your ICP you can reach on LinkedIn compared with other channels. Work out your LinkedIn budget from your revenue target first.
Off-hours and weekends often cost less, because fewer advertisers are bidding. Engagement is usually lower then too, so cheaper impressions don’t always mean cheaper results. Check the hourly breakdown for your own account before you change the schedule.
LinkedIn clicks cost more than Google Ads or Facebook Ads clicks, because you are paying for targeting by job title, seniority and company. The comparison that matters is cost per qualified account, since a cheap click from outside your ICP is still wasted spend.
They can be, and the way to find out is to connect ad activity to pipeline and revenue. Influenced pipeline and Won ROAS show whether a campaign is producing deals. Clicks and CPL alone can’t show that.
Costs follow auction density and purchasing power. Markets where many advertisers compete for the same professionals cost more. Our report has no country breakdown, so compare regions using your own campaign data.
Book a personalized demo and discover how we can transform your B2B marketing.
See a quick demo video
LinkedIn Ads
Tools & Comparisons
DemandSense vs Linklo on scheduling, exposure control, A/B testing, visitor identification and price — two tools that overlap on delivery and split after it.
LinkedIn Ads
Tools & Comparisons
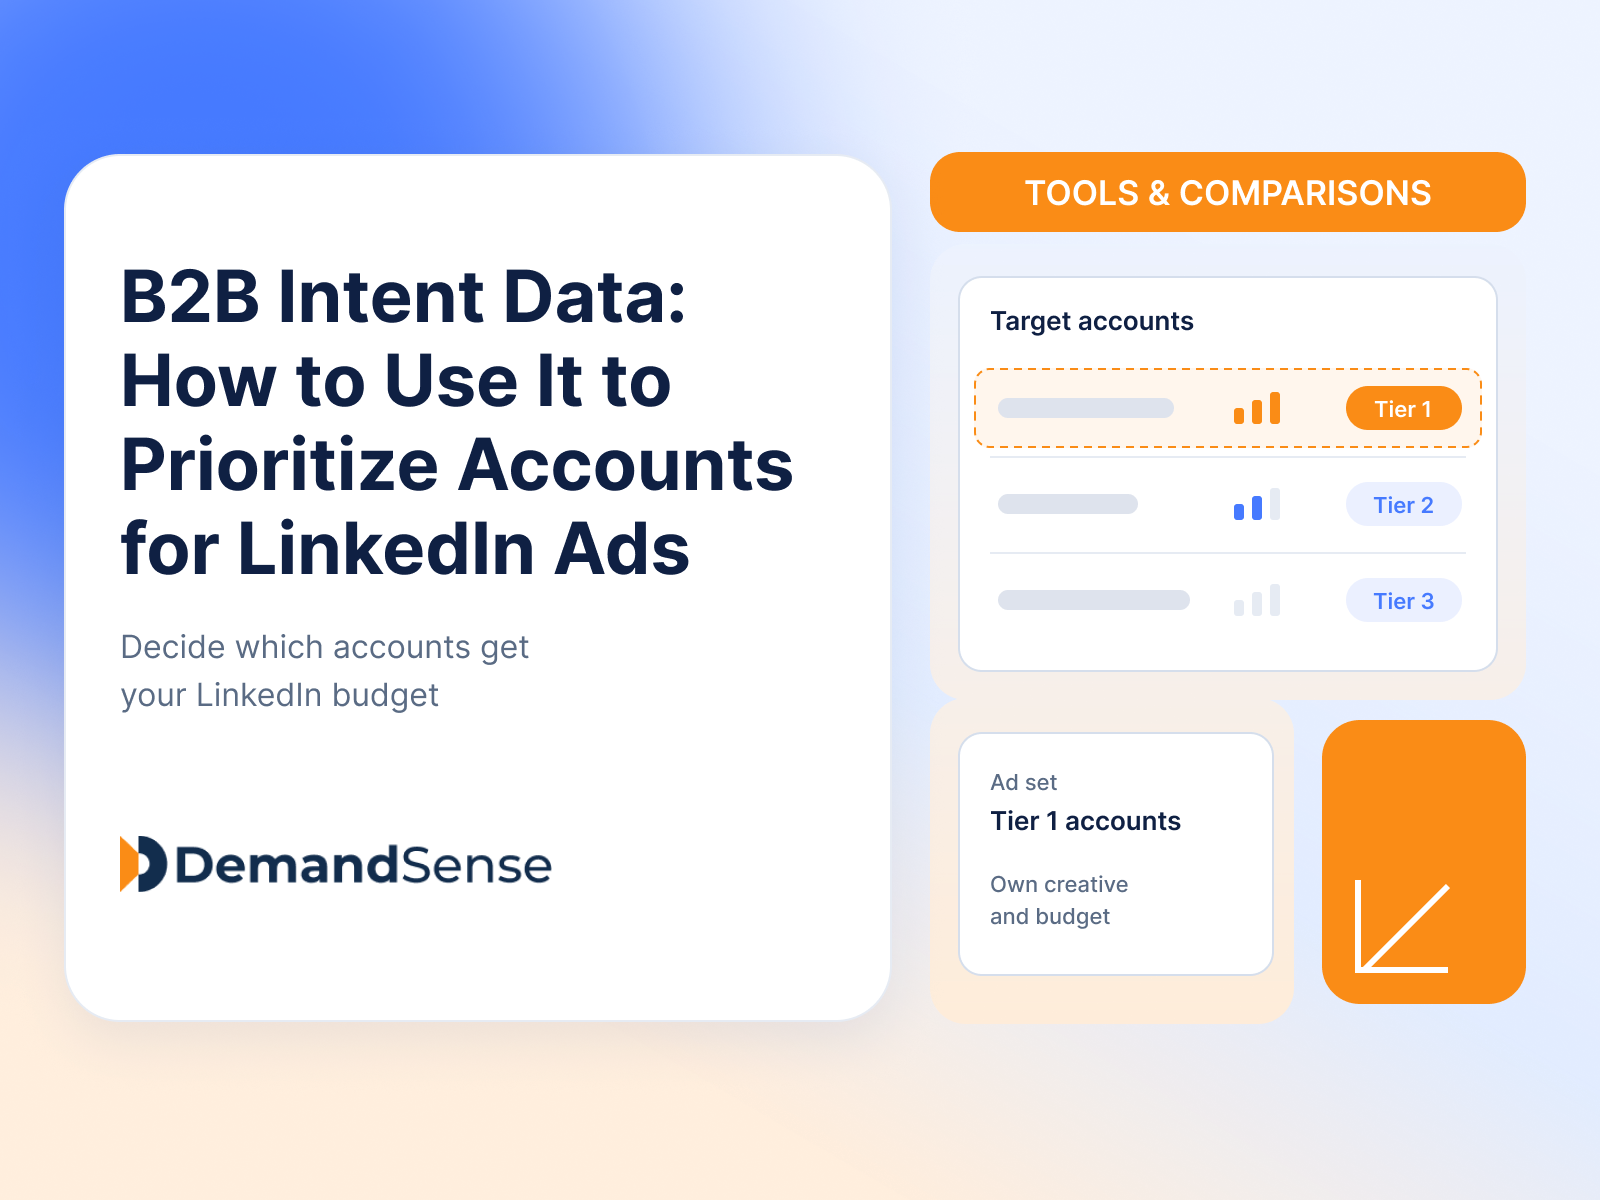
What B2B intent data is, how the main providers differ, and how to use intent signals to decide which accounts get your LinkedIn Ads budget.
LinkedIn Ads
Tools & Comparisons
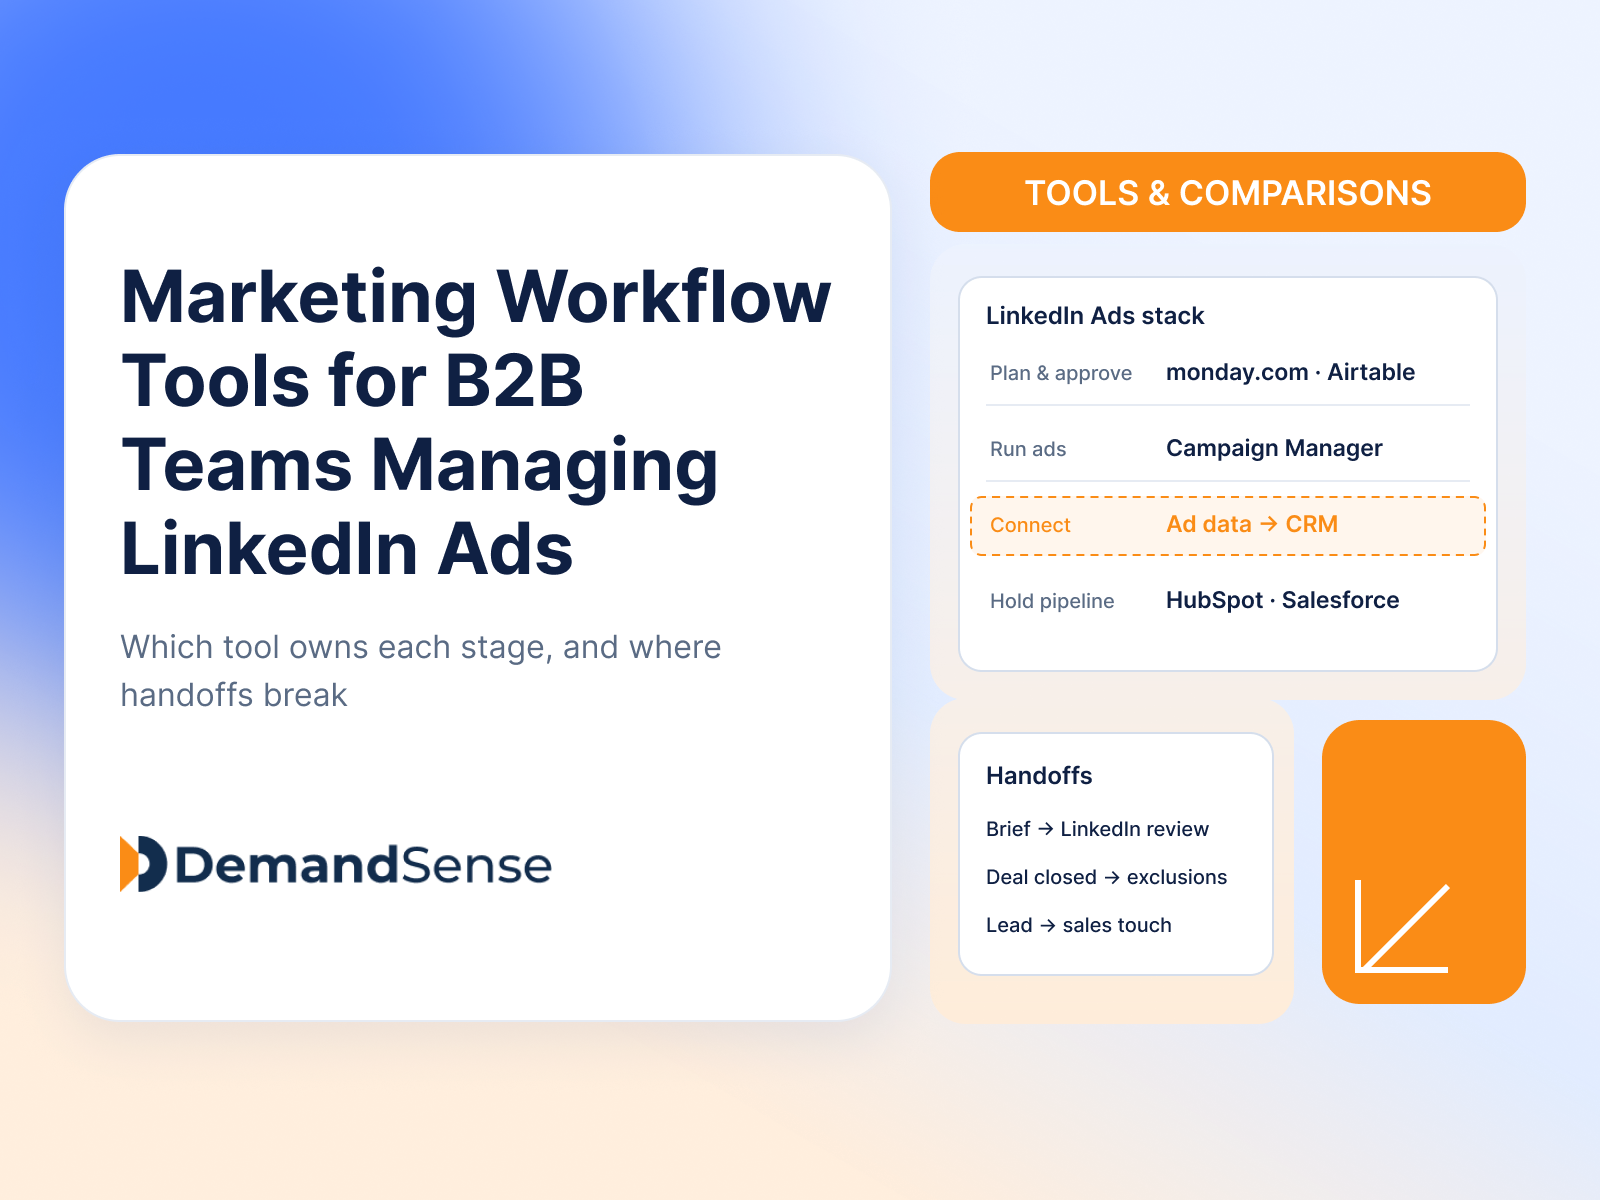
The marketing workflow tools B2B teams use to plan, launch, monitor and measure LinkedIn Ads, which stage each one owns, and where the handoffs break.
Get expert insights and strategies delivered to your inbox weekly.
