••
Insights & Resources
Expert strategies, case studies, and best practices for B2B marketing teams.
Expert strategies, case studies, and best practices for B2B marketing teams.
LinkedIn Ads
Revenue Attribution & Measurement
ROAS and ROI both compare what came back with what went in, but they count different costs:
Launching LinkedIn ad campaigns is the easy part. Proving they work, and knowing what to change when they don’t, is harder. ROAS and ROI are the two key metrics for that job, and they differ mainly in which costs each one counts.
Return on ad spend (ROAS) measures the revenue you generate for every dollar spent on advertising. It’s the first metric to check when you’re judging campaign performance.
ROAS = Revenue attributed to ads ÷ ad spend
It’s expressed as a ratio (3:1) or a multiple (3×). A 3× ROAS means every dollar spent on ads brought back three in attributed revenue.
On LinkedIn, ROAS depends on what counts as “revenue attributed to ads”: clicks only, or account-level impressions too, and how far back your lookback window reaches. Two campaigns with identical spend can show a higher ROAS or a lower ROAS purely because of those settings.
LinkedIn ads ROI (return on investment) is the profit or loss your LinkedIn program makes relative to everything it cost.
ROI = (Revenue − total cost) ÷ total cost × 100
It’s expressed as a percentage. Unlike ROAS, ROI accounts for every cost of the program:
ROI tells you whether the marketing investment is profitable. The catch is that it needs closed revenue, so it lags the campaign by the length of your sales cycle.
Here are the key differences between ROAS and ROI side by side:
| Criterion | ROAS | ROI |
|---|---|---|
| Focus | Revenue generated against ad cost | Net profit against total investment |
| Scope | A single campaign or channel (tactical) | The whole program (strategic) |
| Included costs | Media only | Media plus creative, tools, people, agency fees and the cost of delivery |
| Formula | Revenue attributed to ads ÷ ad spend | (Revenue − total cost) ÷ total cost × 100 |
| Best for | Weekly campaign decisions | Channel and budget decisions |
In B2B there’s one more difference between ROI and ROAS, and it’s time. You can read ROAS against pipeline within weeks of a campaign going live, while ROI has to wait for deals to close. With sales cycles that run for months, ROAS is the metric you can make ongoing campaign decisions with.
ROI and ROAS describe the same spend, so the choice depends on the decision in front of you.
ROAS helps you compare campaigns, audience segments, creative and ad formats on a like-for-like basis, and decide where your next ad dollar goes.
Its blind spot is everything outside media cost. A campaign can show a strong ROAS while it fills the pipeline with deals that take months of sales time to close, or that never close because the ads reached the wrong people. Read ROAS alongside influenced pipeline at the account level before you scale anything.
ROI helps you answer the question leadership actually asks: is LinkedIn worth the money? It’s the metric for deciding whether LinkedIn as a channel earns its place in the budget, for making the case to finance, and for annual planning.
Its blind spot is timing. You can’t measure it accurately until deals close, which makes it the wrong metric for weekly optimization. Use ROAS to manage campaigns while they run, and ROI to judge the channel once the results are in.
ROAS only takes ad spend into account, so a campaign can look great in the report while the program behind it loses money. Here’s a hypothetical example with round numbers:
Total cost is $10,000 + $15,000 + $20,000 = $45,000.
ROI = ($40,000 − $45,000) ÷ $45,000 × 100 = about −11%
The campaign brought back four dollars for every dollar of spend and still ended in a negative ROI. In B2B, three things usually sit behind a gap like this.
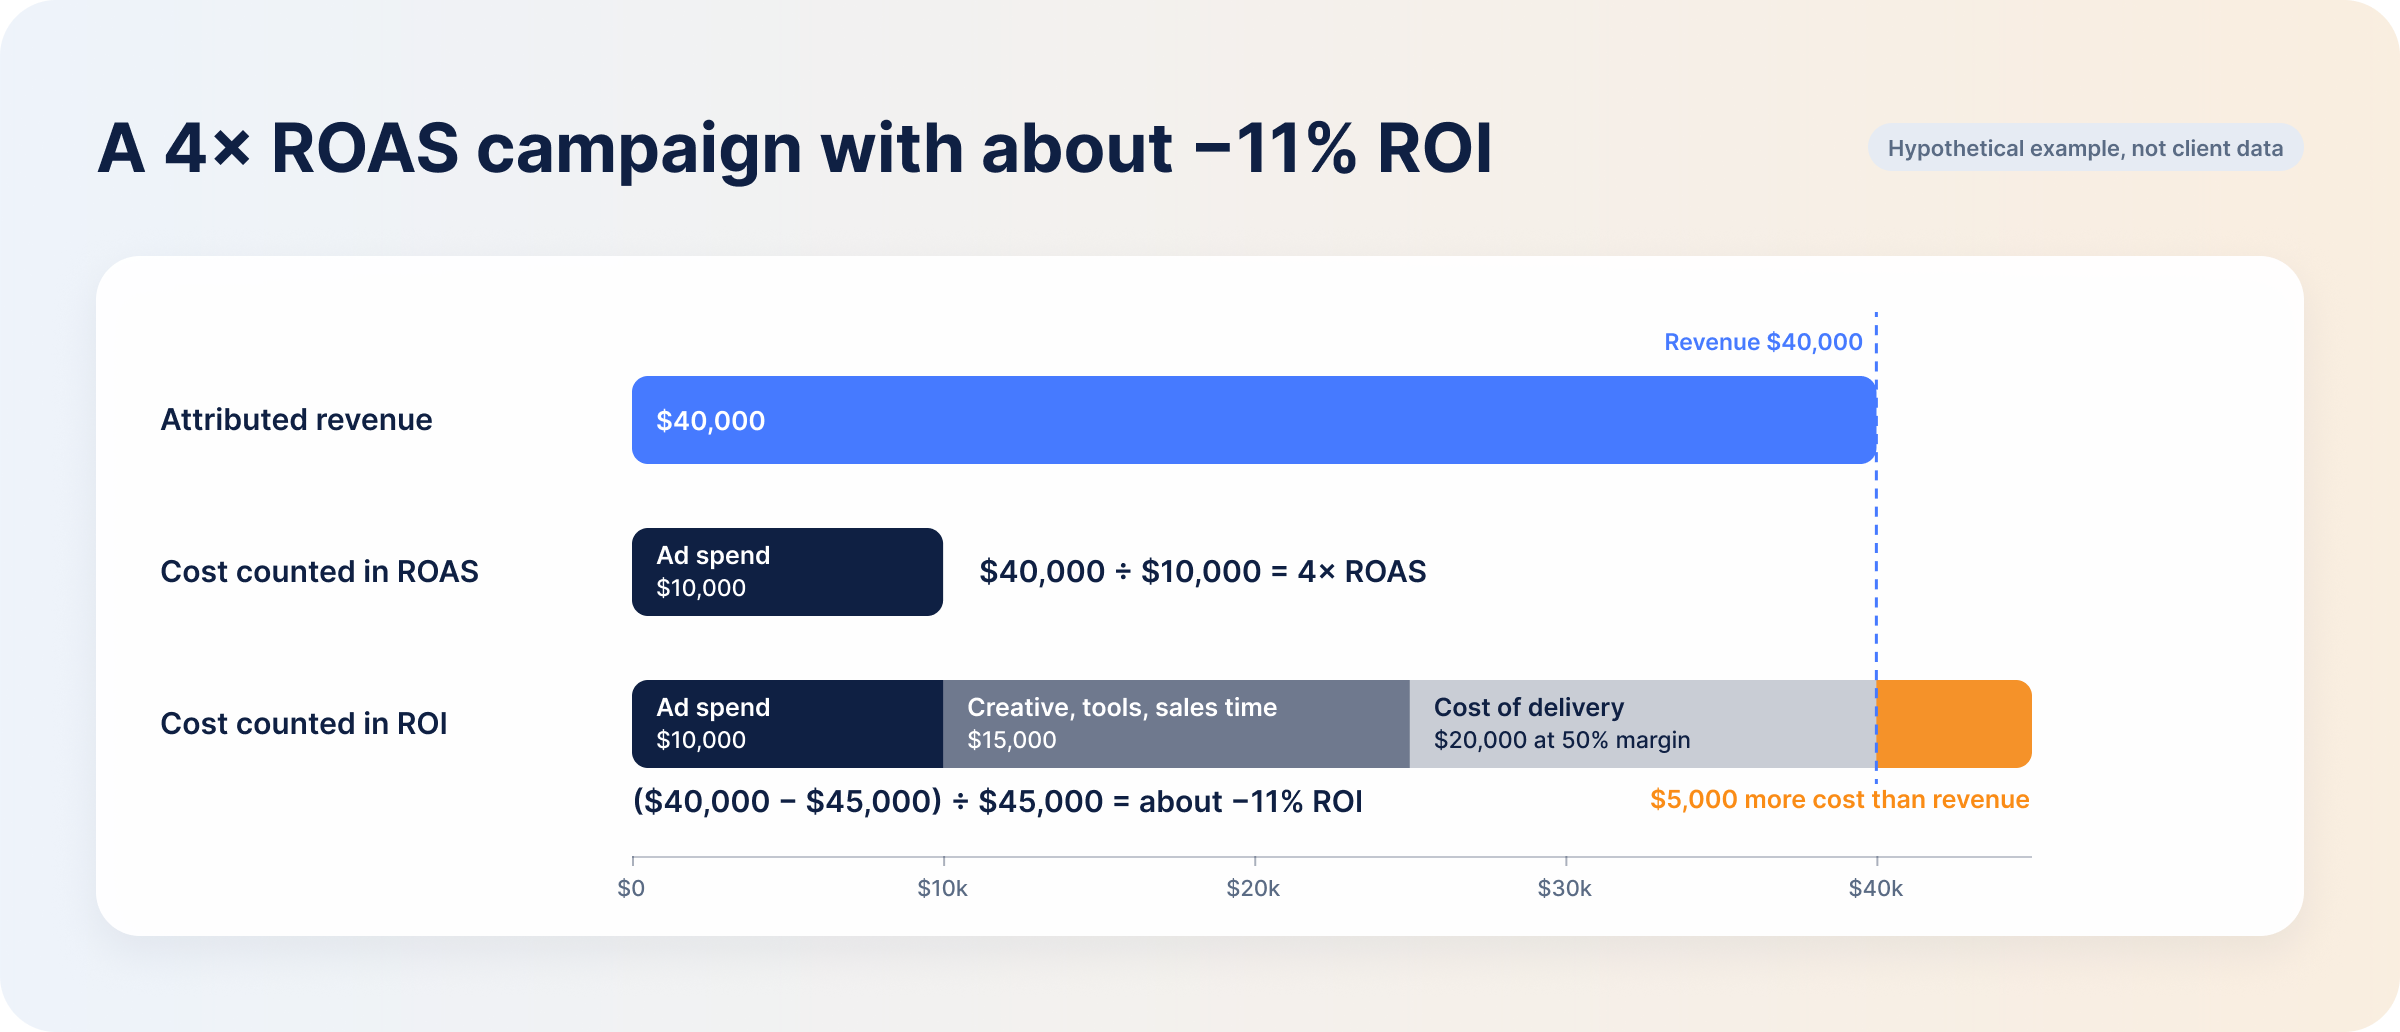
Margin. Break-even ROAS is 1 ÷ gross margin. At a 50% margin you need a 2× ROAS just to cover the media, before any other cost. Services and hardware usually carry lower margins than software, which pushes that line up: halve the margin and break-even ROAS doubles to 4×, exactly where the example campaign sits. A ROAS only tells you something next to your own margin.
Cost of the lead after the click. B2B buyers rarely convert straight after a click, and every lead still has to be worked by sales before it turns into revenue. None of that time shows up in ad spend. The route a lead takes also changes what it costs: in our 2026 LinkedIn B2B Benchmark Report, leads from native Lead Gen Forms averaged $810.83, against $221.14 for leads from an external landing page. A campaign built on the expensive route needs far more revenue per lead to hold its ROAS, before sales has spent an hour on it.
Deal quality. A high-ROAS campaign that fills the pipeline with deals that close late, close small or churn early looks worse the longer you measure it. ROAS alone won’t show you that. You need your LinkedIn data read against CRM outcomes to see whether the ads bring in customers who stay.
Both, at different times. ROAS is the leading indicator you can act on every week, and ROI is the lagging one that tells you whether the channel paid off.
Optimize campaigns on ROAS measured against pipeline and won revenue at the account level. The account view counts LinkedIn’s influence on the whole buying committee, not only the one person who filled in a form.
Be careful with last-click ROAS in particular. The default LinkedIn attribution model in Campaign Manager gives full credit to the last ad interaction before a conversion. That favours the campaigns closest to the form fill and gives little or nothing to the ones that reached the account first, so optimizing to it tends to cut the campaigns that started the deals. Keep funding the ones that influence high-value accounts, even if their last-touch ROAS looks lower.
Then, once a full sales cycle has closed, use ROI to judge the channel.
Creative, audience, bidding, sales follow-up and deal size all move these numbers, but in different places. ROAS responds to what happens in the ad account. ROI also depends on what happens after the click, in sales and in the product.
Each lever either raises the numerator (attributed revenue) or lowers the denominator (ad spend). Our tactics to improve LinkedIn ad ROAS cover each one in more depth.
Three of these four happen after the click. Sales conversion, deal value and lifetime value sit in your CRM rather than in Campaign Manager, and you only see their effect once deals close. That’s why ROI belongs to the channel decision, not the campaign decision.
You can only calculate ROAS at the stages where a dollar value exists: pipeline and closed-won revenue. Both live in your CRM, not in Campaign Manager. To track LinkedIn ad revenue, read your LinkedIn data, website activity and CRM side by side, stage by stage:
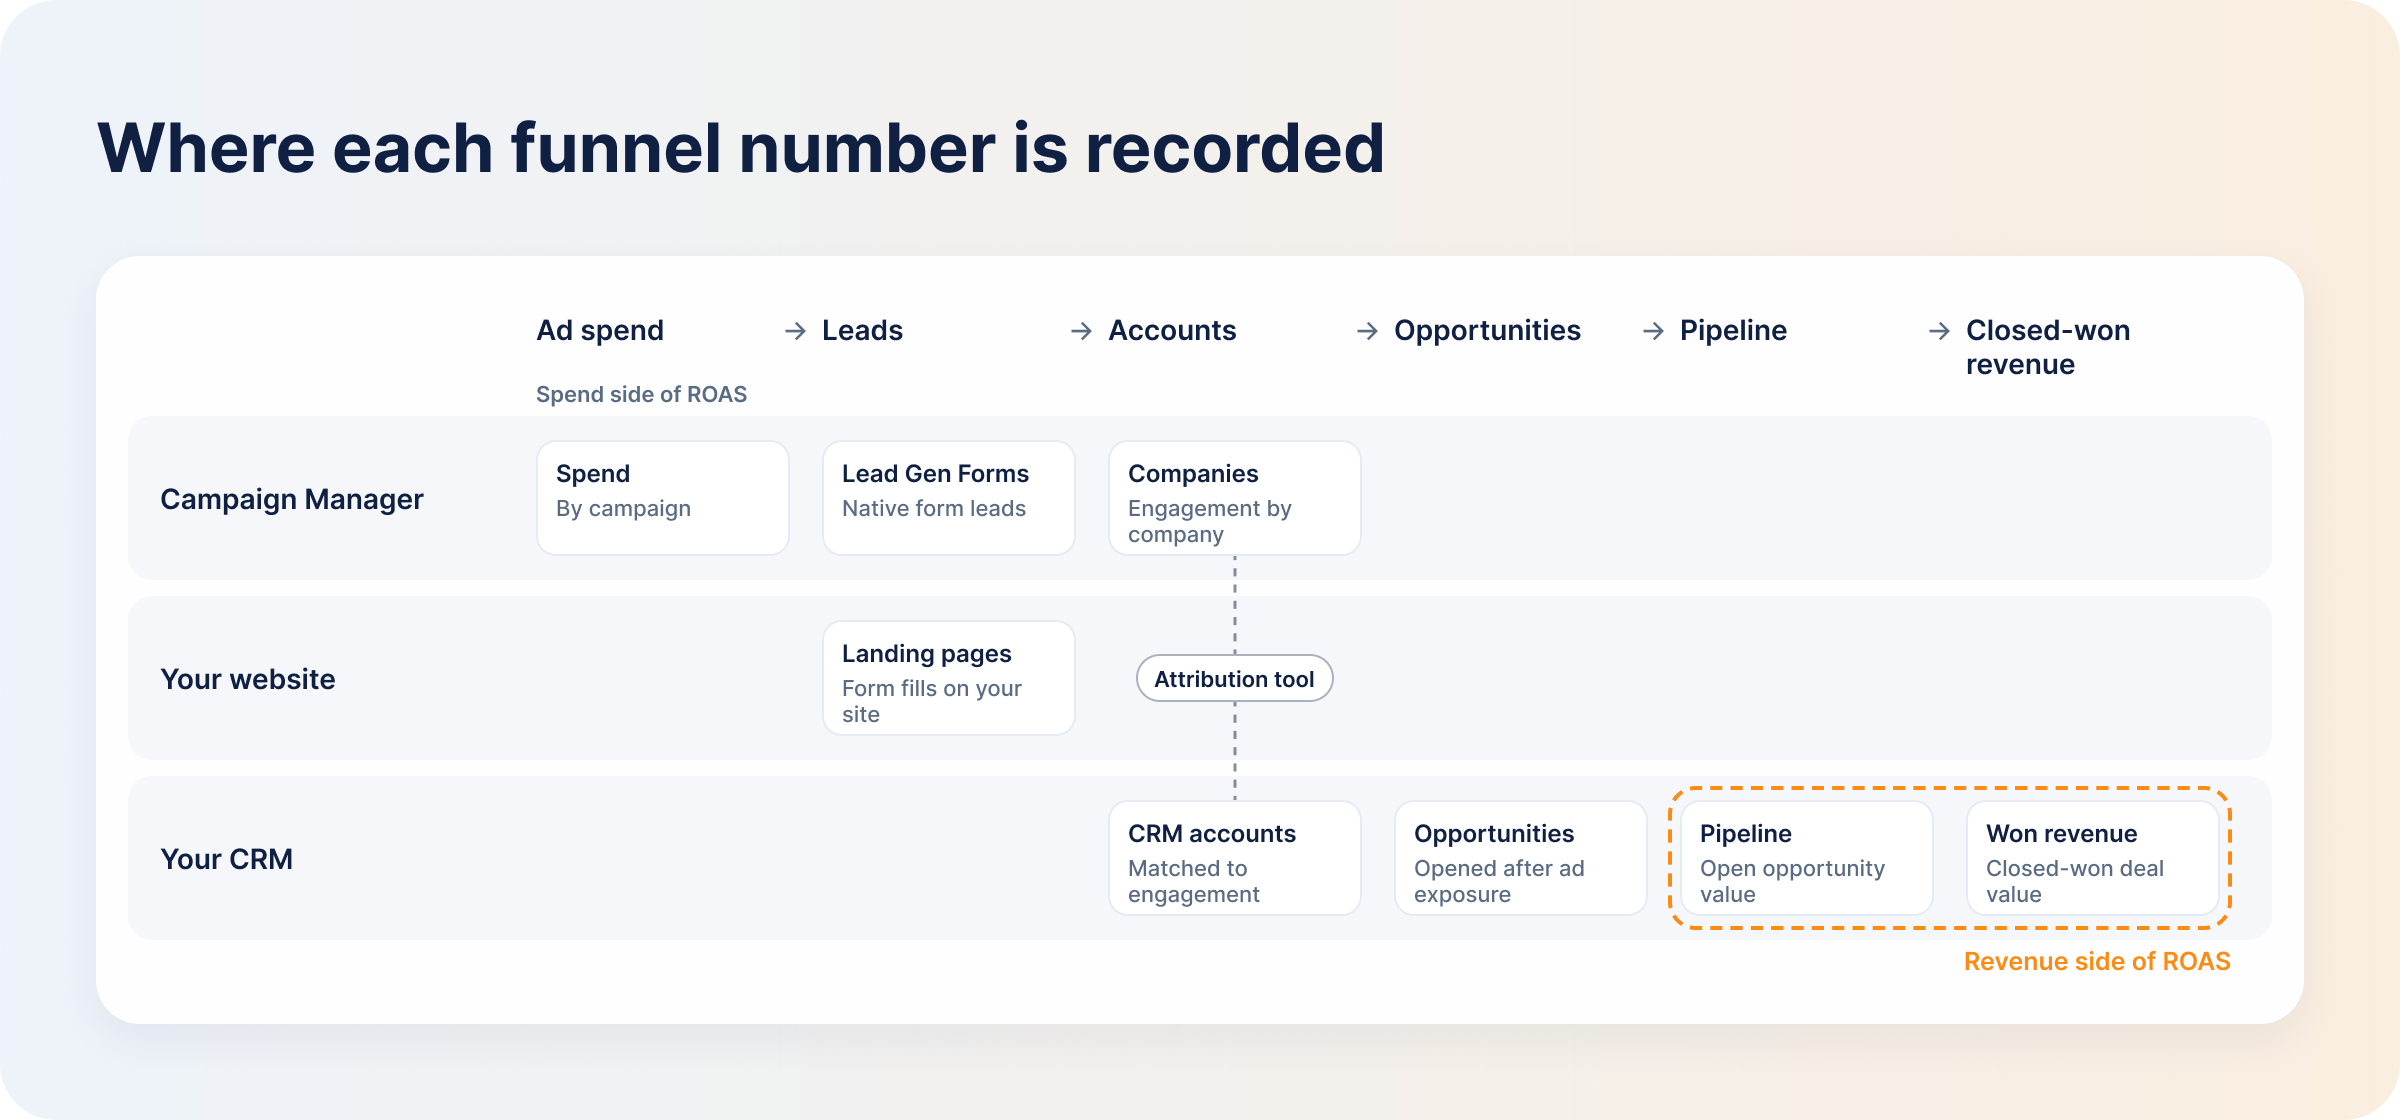
Click attribution credits only the person who clicked. Account-level impression attribution credits the account that saw your ads before the deal was created. For B2B, the second gives you the more honest numerator, because most of a buying committee never clicks an ad. Count clicks only and campaigns that were part of the buyer’s journey look like they did nothing. View-through attribution is how those impressions get counted.
Not every opportunity becomes a won deal, so calculate these two separately:
Whichever you track, set the lookback window to match your sales cycle. If the window is shorter than the cycle, revenue ROAS understates every campaign.
Campaign Manager’s reporting stops at the form fill. The pipeline and revenue that both ROAS readings need are in your CRM, and without the two read together you’re left guessing which campaigns produced deals.
DemandSense revenue attribution reads your LinkedIn engagement alongside the deals in HubSpot, Salesforce or Attio, and reports influenced pipeline and closed-won revenue per campaign. That pipeline attribution happens at the account level, so influence counts when the account saw your ads, not only when someone clicked. You decide what “influenced” means with three presets (Awareness, Engagement and Intent) or your own thresholds, and set a 3-, 6- or 12-month lookback to match your sales cycle.
Won ROAS is the revenue ROAS: revenue on won deals against the spend that influenced them. Spend Protection stops spending on accounts that have already closed, which improves ROI by removing cost rather than adding revenue.
ROI also needs your full cost base (salaries, agency, tools, content), and that lives in your finance model, not in any ad tool. DemandSense gives you the revenue side per campaign, and you bring the costs to calculate ROI.
Try it on your own campaigns at demandsense.com, free for 30 days — no card needed.
A good ROAS clears your break-even point with room left for the costs ROI adds. Break-even ROAS is 1 ÷ gross margin, so a business with a 50% margin needs a 2× ROAS to break even. A single benchmark ratio doesn’t help much in B2B, because deal size, margin and sales-cycle length vary too much between advertisers for one number to mean anything.
Yes, as a separately labelled pipeline ROAS, never blended with won revenue. Not every open opportunity closes, but pipeline gives you a number to optimize on weekly while you wait for deals. If you present it to finance, weight it by stage or win rate.
At least one full sales cycle for the segment you’re advertising to, plus the attribution lookback window you use. Until then, read pipeline ROAS and account engagement. Campaign Manager’s standard conversion windows run up to 90 days, which many B2B sales cycles outlast. DemandSense offers a 3-, 6- or 12-month lookback so the window can match the cycle.
No. It connects your CRM to LinkedIn and reports LinkedIn-influenced pipeline, won revenue and ROAS, which makes it a ROAS view of one channel. It carries no costs beyond media and no other channels, so for ROI you still need your full cost base from your own model.
Yes, as long as you apply the rule consistently. Most B2B buyers see ads without clicking, and those impressions still influence pipeline. Use the same rule for every campaign and every period, and state it in the report, so nobody can accuse the number of being flattering.
Get expert insights and strategies delivered to your inbox weekly.
Book a personalized demo and discover how we can transform your B2B marketing.
See a quick demo video
LinkedIn Ads
Revenue Attribution & Measurement
What attribution reporting shows B2B teams, which report types to run for LinkedIn campaigns, and how to read the numbers without fooling yourself.
LinkedIn Ads
See the average LinkedIn CPC in 2026, what a good CPC looks like, and what the metric can and can’t tell you about B2B campaign performance.
LinkedIn Ads
Revenue Attribution & Measurement
How B2B social media marketing works on LinkedIn: which platforms earn a place, what to post, and how to turn engagement into measurable pipeline.