••
Insights & Resources
Expert strategies, case studies, and best practices for B2B marketing teams.
Expert strategies, case studies, and best practices for B2B marketing teams.
Ask Claude anything about your LinkedIn Ads, website visitors and CRM deals. DemandSense MCP
Private early access
LinkedIn Ads
Revenue Attribution & Measurement
An attribution report shows which touchpoints a deal passed through on its way to closing and how much credit each one gets. It answers “which campaigns are building pipeline?”, which is a different question from “which campaign got the last click?”. What it can’t tell you is what would have happened if a campaign hadn’t run. It shows a pattern across deals, and reading it well comes down to knowing which report answers which question.
Attribution reporting is the practice of tracing a deal back to the marketing touchpoints that came before it and giving each one a share of the credit. In B2B that trace is long. A deal is decided by a buying committee over a sales cycle that can run for months, and it closes in the CRM, well after anyone filled in a form on a landing page.
That’s why B2B attribution reporting has to run on accounts and deals, following what a company touched over time. Reports built on sessions and conversions assume one visitor making one decision in one sitting, which is rarely how a B2B purchase happens.
A few terms come up in every report:
Four report types cover most of what a B2B team needs from its LinkedIn campaigns. Each answers a different question and has its own blind spot, and a common mistake is asking one report another report’s question.
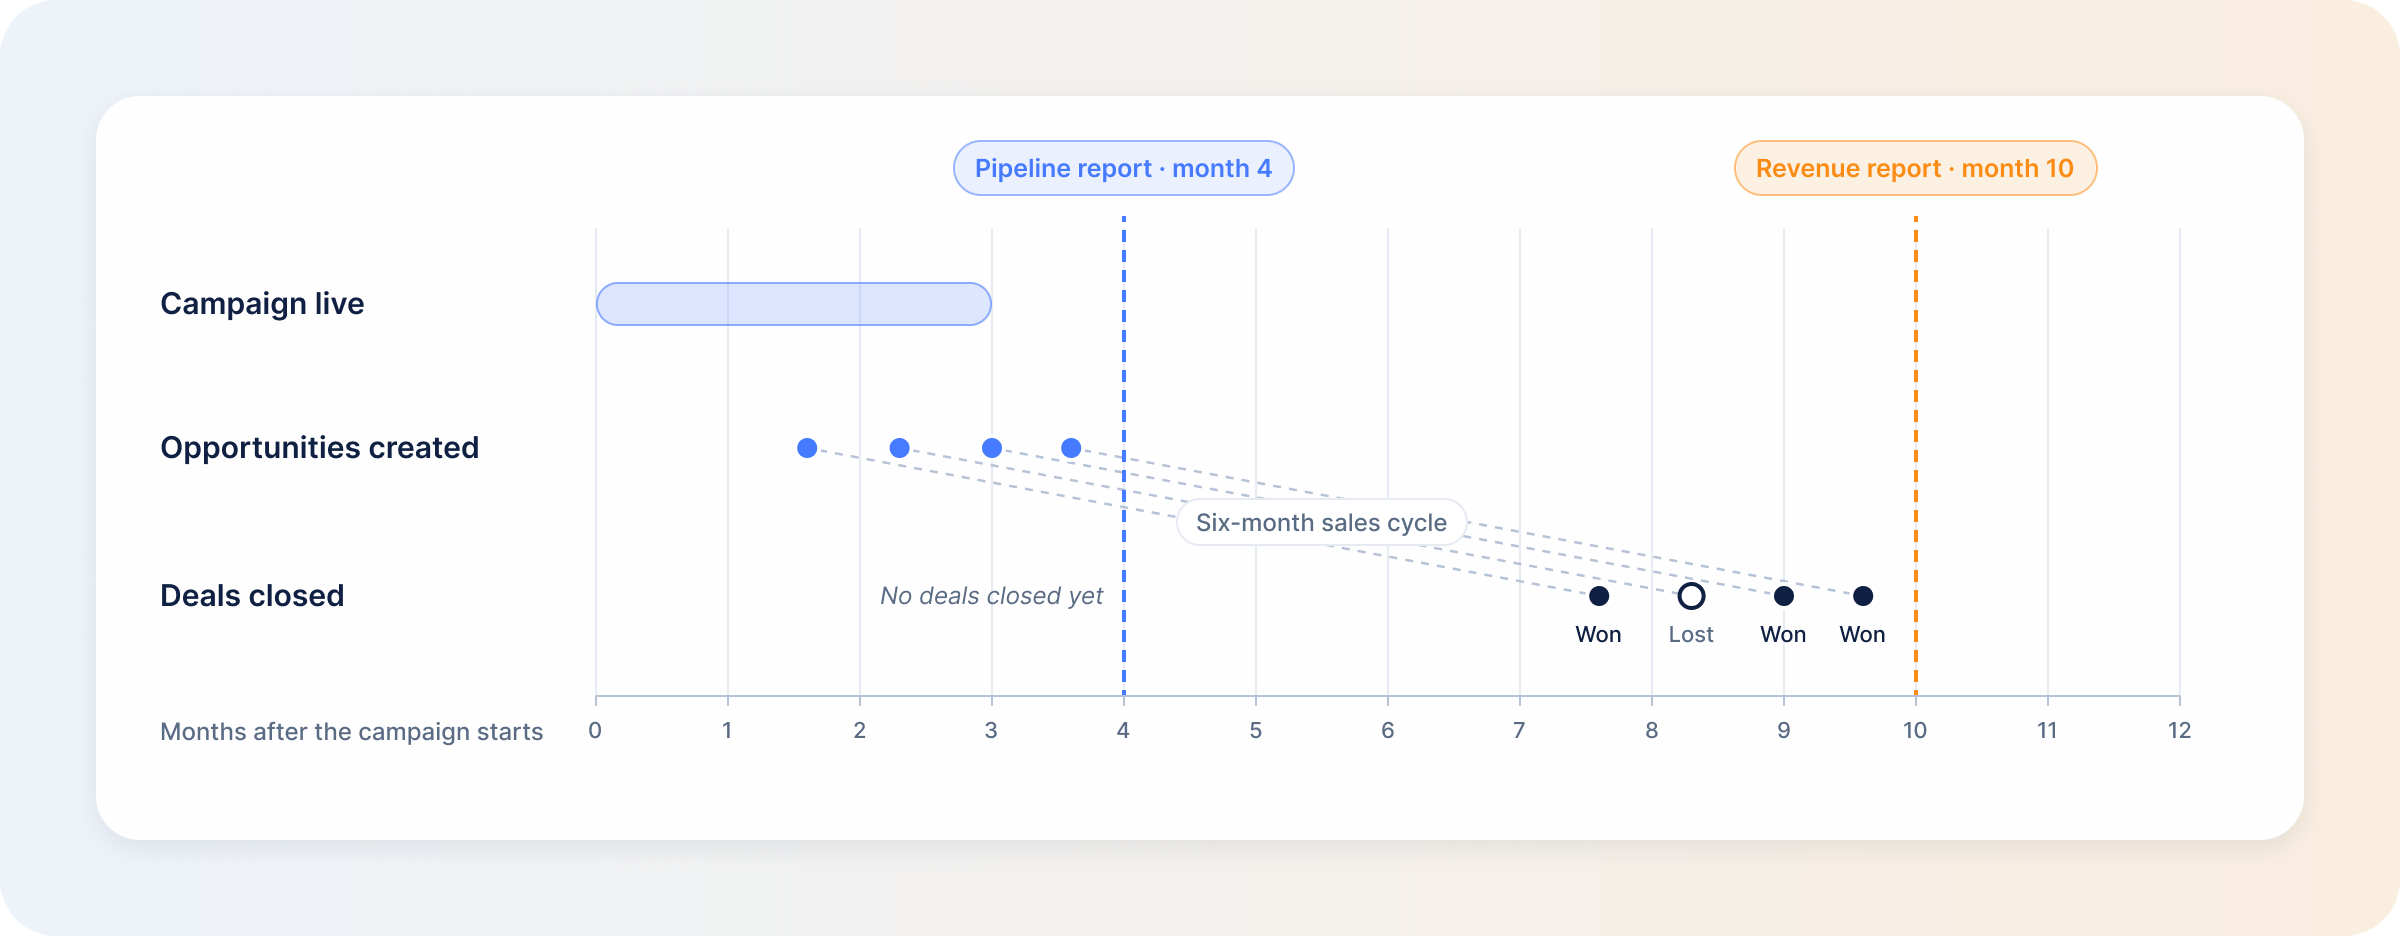
A pipeline attribution report counts the opportunities your campaigns influenced, before any of them have closed. That makes it the earliest read on whether campaigns are reaching accounts that turn into deals. The decision it supports is whether to keep funding a campaign before there’s enough closed revenue to judge it. The blind spot is that influenced pipeline flatters wide settings. Loosen the definition of “influenced” and the number climbs even if performance hasn’t changed, so LinkedIn pipeline attribution only means something once that definition is fixed.
A revenue attribution report measures closed-won revenue against spend, and it’s where Won ROAS lives. It supports the decision finance cares about most: whether a campaign paid off in revenue. Its limitation is lag. The report can only grade a campaign once its deals have closed, so with a six-month sales cycle, a report you run today is grading campaigns from two quarters ago. That’s the reason to run it alongside the pipeline report rather than instead of it.
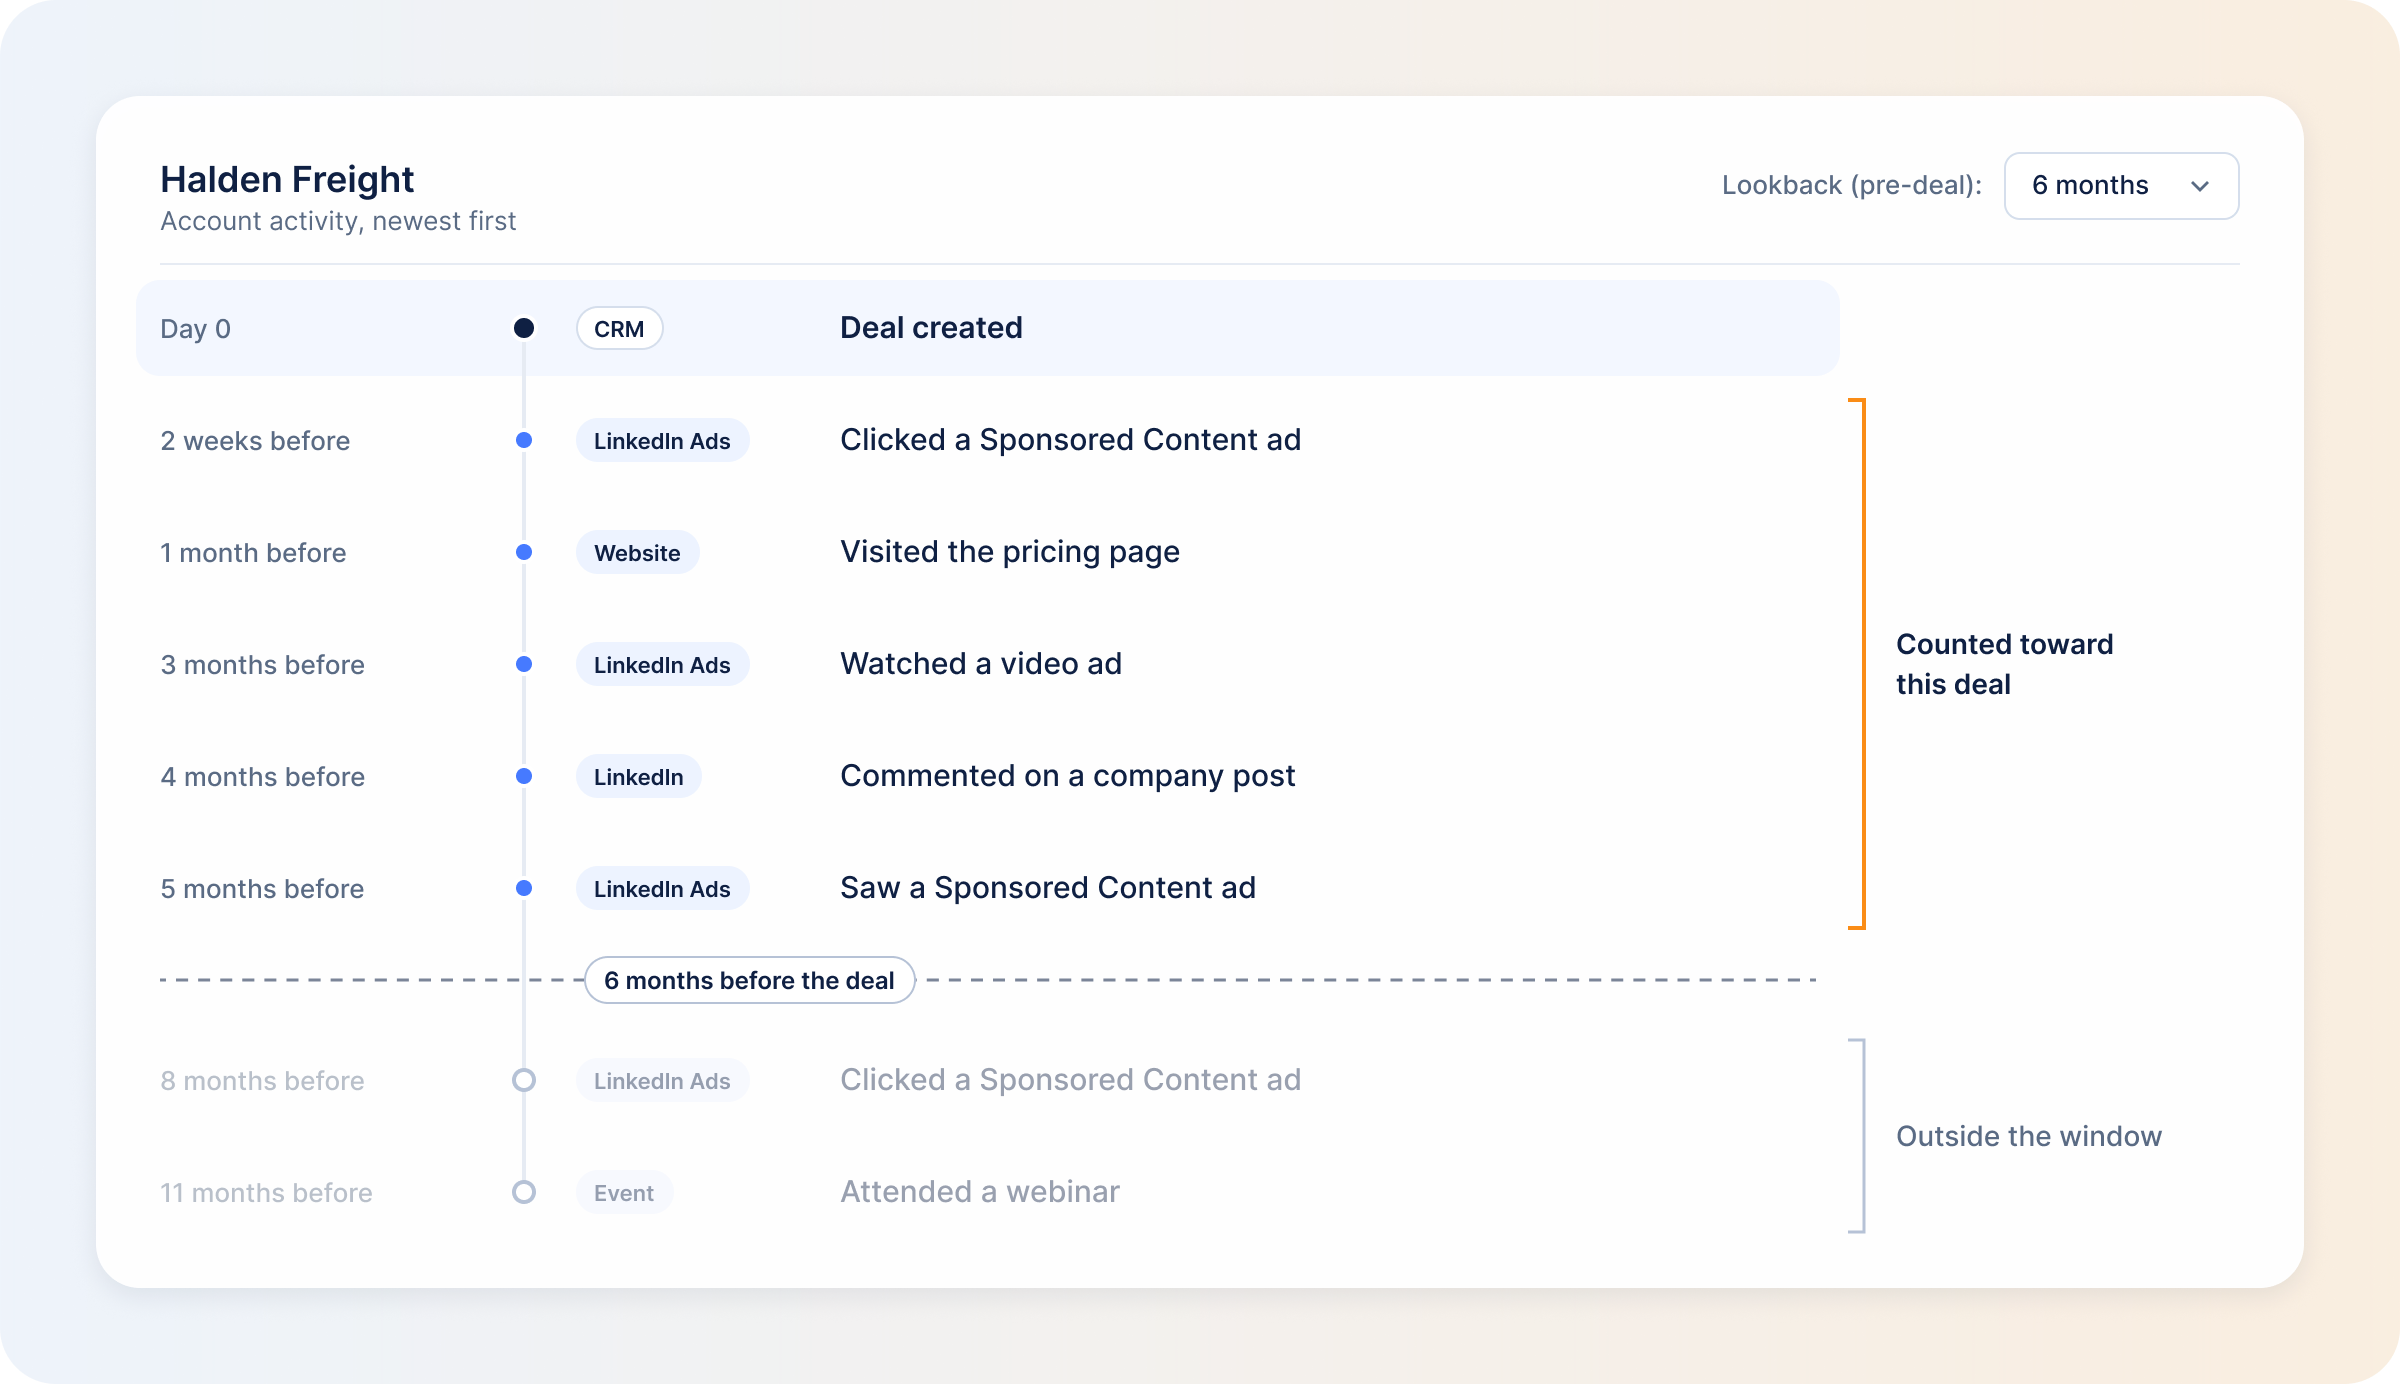
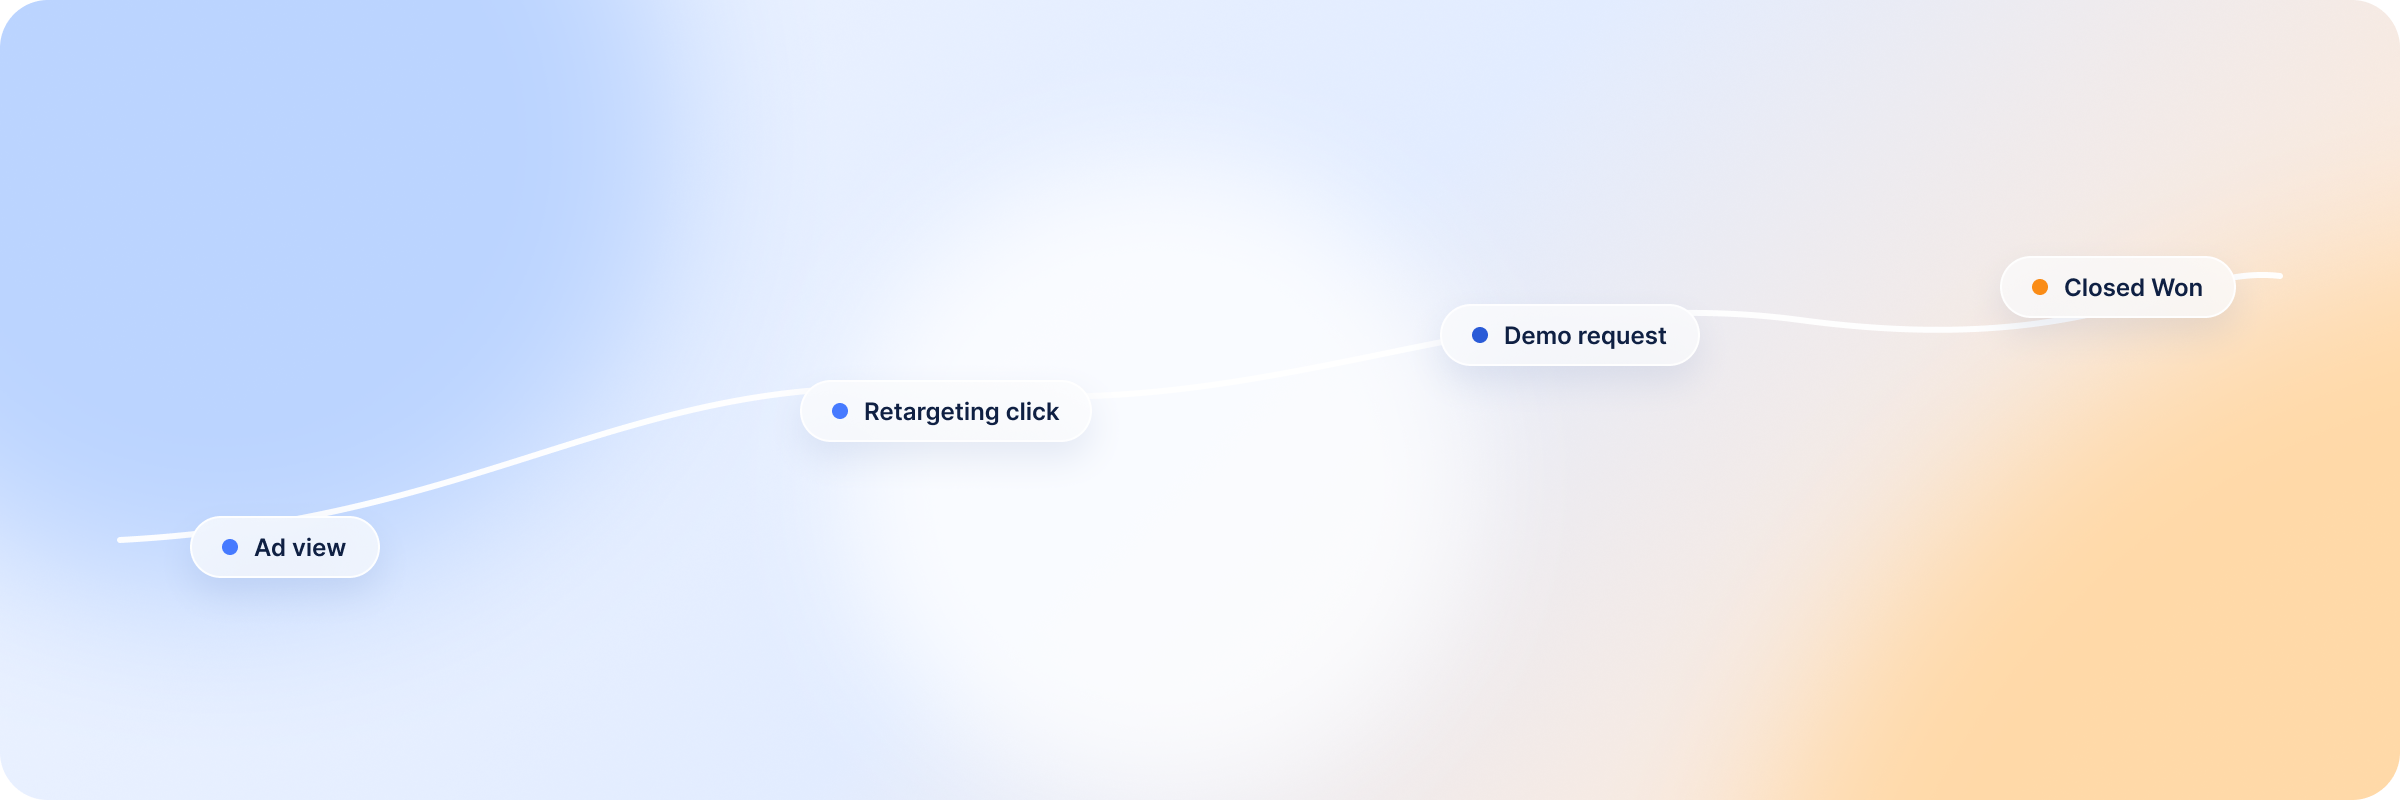
A customer journey report shows the sequence: what an account touched, in what order, over what period. It’s best for spotting touchpoints that keep showing up before deals close, less so for scoring any single one. The blind spot is coverage. A journey is only as complete as the sources feeding it, so an untracked event, referral or sales conversation leaves a gap that reads as if nothing happened.
Attribution reports run at two grains, campaign and account, and in B2B the account level is the one that matches how deals happen. Five people from the same company engaging with your ads are one buying committee, and counting them as five leads overstates what the campaign did. Account-level reporting supports the decision about where to concentrate spend. The blind spot sits on the campaign side: a campaign-level report counts the same account once for every campaign that reached it, so the totals add up to more accounts than you engaged.
Every report has to decide how credit gets split. These are the attribution models B2B teams use most:
| Model | How credit is assigned | Best for | Main limitation |
|---|---|---|---|
| First-Touch | All credit to the first touchpoint | Seeing what brings accounts in | Ignores everything that follows |
| Last-Touch | All credit to the last touchpoint before conversion | Seeing what closes deals already in motion | Ignores the work that built the deal |
| Linear | Split evenly across every touchpoint | A simple baseline with no weighting | Treats a passing impression like a sales call |
| U-Shaped | Most credit to first touch and lead creation, the rest to the middle | Weighing discovery and conversion equally | Undervalues the middle of the journey |
| W-Shaped | Most credit to first touch, lead creation and opportunity creation | Journeys with clear lead and opportunity stages | Needs clean CRM data at all three stages |
| Full-Path | Most credit to first touch, lead, opportunity and close, the rest to the middle | Following a deal all the way to close | Needs every stage tracked in the CRM |
| Time Decay | More credit the closer a touchpoint is to conversion | Seeing what moved deals in the final stretch | Undervalues the touches that started the relationship |
| Data-Driven | An algorithm sets the weights from past conversion paths | Teams with enough deal volume for it to hold | Hard to explain, and unreliable on low volume |
Switching models changes what the report shows without changing anything the campaign did. So pick one, keep it, and compare the same report quarter to quarter.
Seven metrics carry most of the weight in an attribution report:
Report on the account-level metrics first and the click-level ones second. Clicks are what LinkedIn can see, and accounts are what your CRM can see. The click-level LinkedIn Ads metrics, like CTR, CPC and cost per lead, still tell you how the ads are running, so they belong in the report, just further down.
Attribution reporting is a matching exercise between two systems that don’t share data by default.
On one side is ad activity: impressions, clicks and engagements on LinkedIn. On the other is the CRM: accounts, contacts and deals moving through the pipeline. Without a connection, LinkedIn doesn’t know whether an account it reached became an opportunity, and the CRM doesn’t know the account ever saw an ad.
The connection happens in three steps:
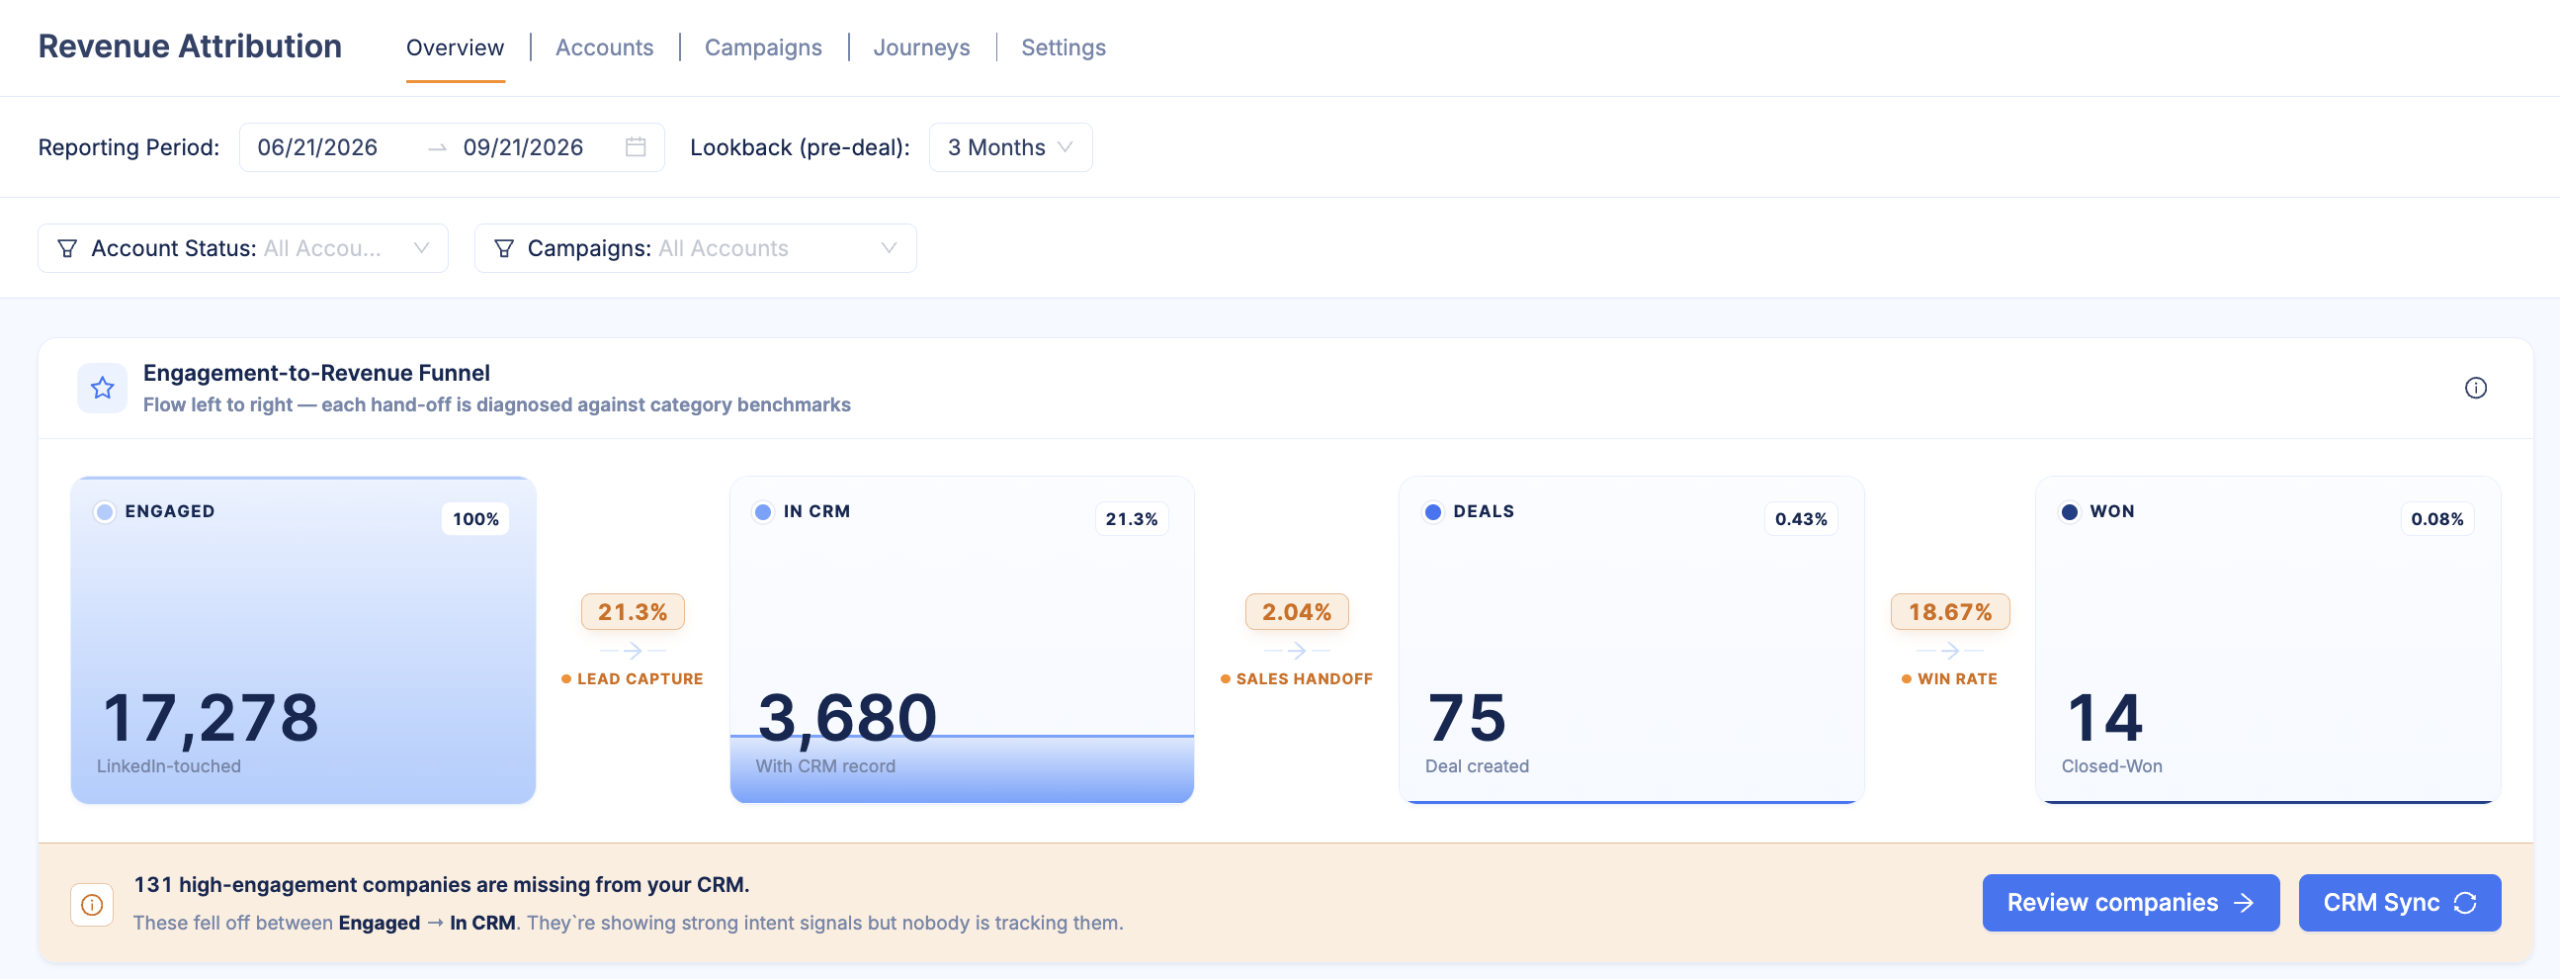
On its own, Campaign Manager reports conversions and has no view of deals. The furthest native LinkedIn Ads reporting goes is CRM Sync in Business Manager: connect Salesforce, Microsoft Dynamics or HubSpot and you get a Revenue Attribution Report with pipeline, revenue won and ROAS, credited at company level. What that report credits is LinkedIn activity, under LinkedIn’s rules. A Google ad, a webinar or a sales call isn’t in it, and if your CRM isn’t one of those three, the report isn’t available to you.
Whether anyone trusts the report depends less on the tool than on a few habits the team agrees on early:
These five tools cover the range B2B teams usually build these reports in, from reporting inside your CRM to dedicated B2B attribution software. The table covers what each one is for when you’re building reports:
| Tool | Best for | Attribution focus | B2B fit |
|---|---|---|---|
| DemandSense | B2B teams running LinkedIn Ads who want influence read by account | Paid and organic LinkedIn engagement read alongside CRM accounts and deals, with influence you define | LinkedIn-first, with Google Ads, Facebook Ads and StackAdapt tracked too; native HubSpot, Salesforce and Attio |
| HubSpot | Teams whose marketing and CRM data already live in HubSpot | Contact, deal and revenue attribution reports built on HubSpot’s own records | Strongest when HubSpot is the system of record for marketing and sales |
| HockeyStack | Teams that want attribution next to website and product analytics | Journeys across ads, website, product usage and sales activity | B2B SaaS teams that want marketing, sales and product data in one workspace |
| Dreamdata | Account-based revenue attribution as a dedicated function | B2B revenue attribution built around account journeys | Teams that want a standalone attribution platform across channels |
| Factors.ai | Attribution alongside account identification and intent | Attribution inside a broader account analytics suite | ABM teams that want identification, intent and attribution in one tool |
Most of what AI adds to attribution reporting is speed in the work around the report. Three uses of AI analytics hold up in a real reporting workflow:
The limit is worth stating once. AI changes how fast you get to the number. Whether the number is right still depends on the model, the lookback window, and how complete the data sources are.
Every report above depends on reading LinkedIn activity and CRM outcomes together, at account level, under rules you chose. In most teams the link between the two is LinkedIn’s own report or a spreadsheet someone rebuilds every month.
DemandSense reads paid and organic LinkedIn engagement alongside the accounts and deals in HubSpot, Salesforce or Attio, with webhooks for other CRMs. Influence is broken down by campaign, audience, account and segment (industry, headcount, country). You decide what counts as influenced, with the Awareness, Engagement or Intent preset or thresholds of your own, so the first best practice above is settled once in the settings.
Per-account journeys show what each company touched and in what order, and Won ROAS puts revenue from closed deals against spend, which is how you track LinkedIn ad revenue rather than pipeline that might close. Audience Intent Signals lists the accounts with high ad engagement and no deal in the CRM, usually the part that turns into work the same day.
Try it on your own campaigns free for 30 days at demandsense.com, no card.
Review pipeline-side reports monthly, since that’s the pace campaign decisions get made at, and revenue-side reports quarterly, since that’s the earliest the sales cycle can answer for closed deals. A weekly look mostly measures noise, because too few deals move in a week.
Enough closed-won deals to show a pattern, and at least one full sales cycle of history inside your lookback window. An under-powered report still looks confident, with a sharp percentage built on a handful of deals. If most of its deals are still open, it’s a pipeline report.
Yes, if the tool records impressions at account level, and it matters more than it sounds. The average LinkedIn CTR in our 2025 benchmark report is 0.52%, so most people an ad reaches never click. A click-only report grades a campaign on a sliver of its reach, the gap view-through attribution covers.
Yes, if you want the report to hold up with the sales team. Calls, demos and follow-ups make the journey complete, but they also shrink marketing’s share of the credit. Agree on that trade-off before the first report goes out rather than after someone questions the numbers.
They count different things over different windows. The ad platform counts conversions from people it served ads to, inside its own lookback. The CRM counts deals against accounts, on the sales cycle’s timeline. They’ll rarely agree, and that’s expected. Reconciling them means knowing which one answers which question.
Get expert insights and strategies delivered to your inbox weekly.
Book a personalized demo and discover how we can transform your B2B marketing.
See a quick demo video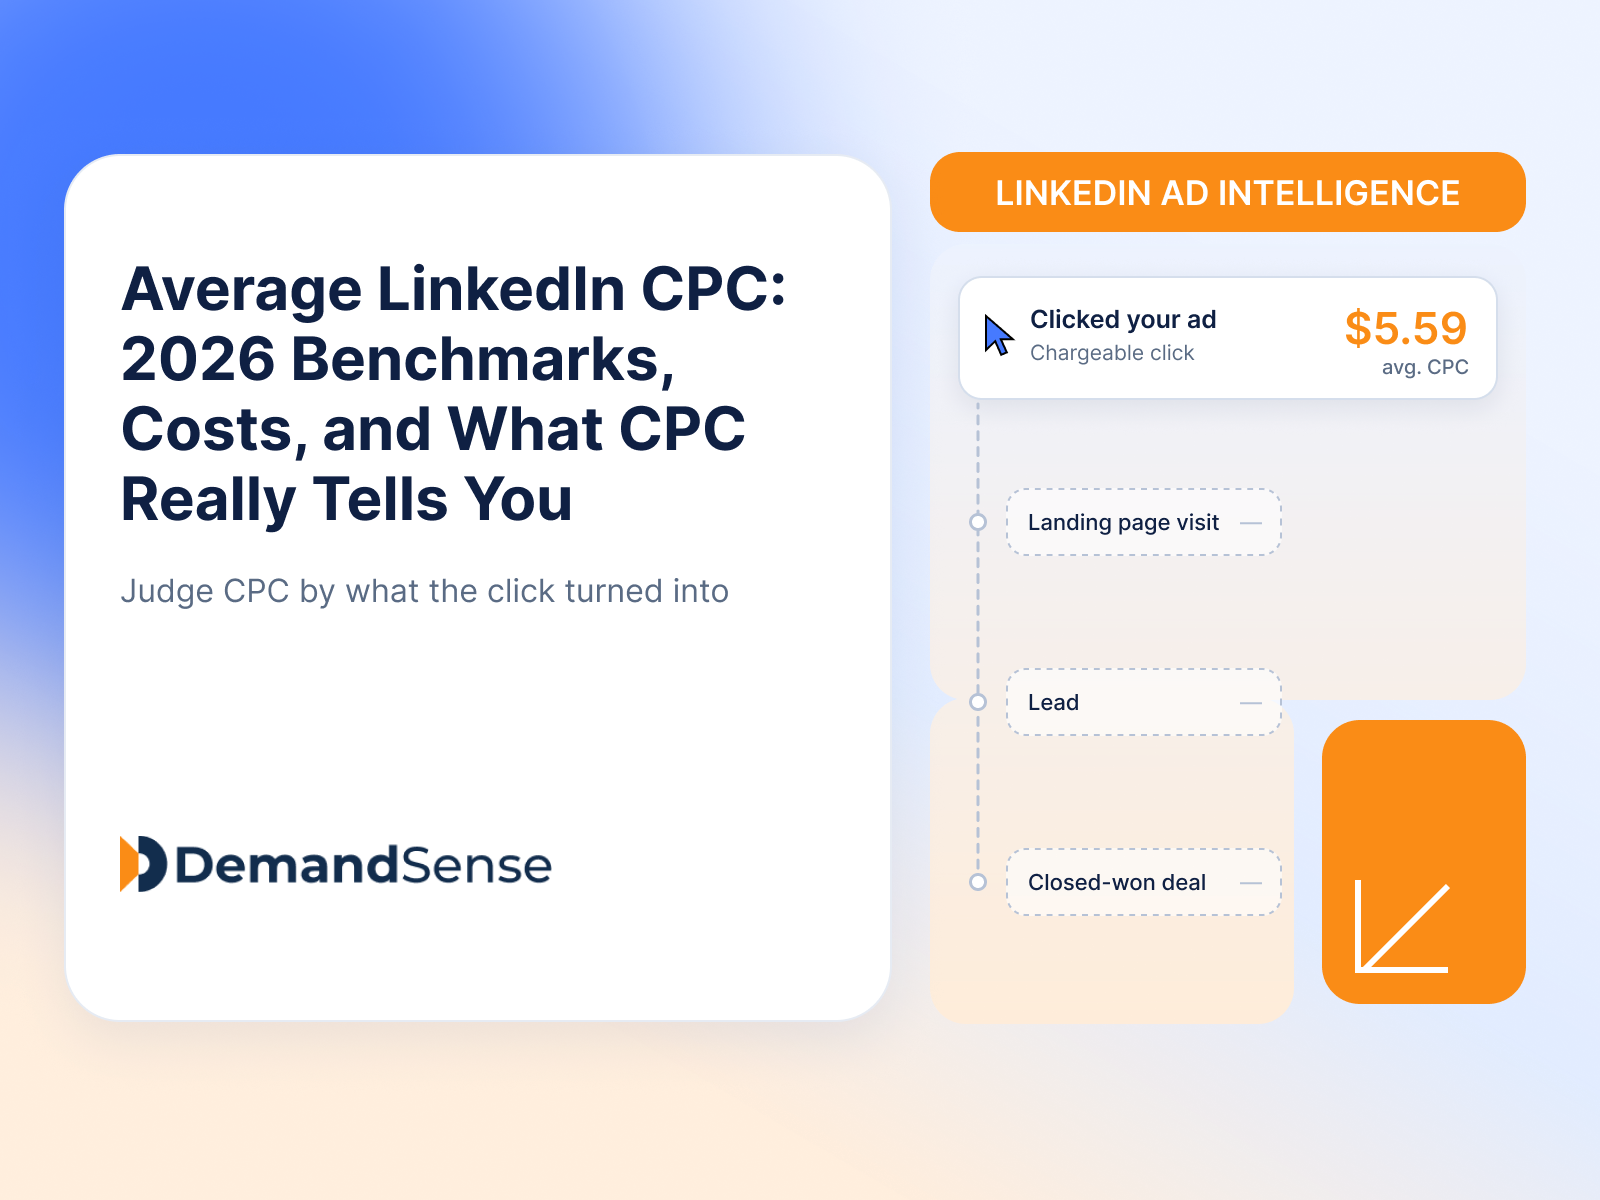
LinkedIn Ads
See the average LinkedIn CPC in 2026, what a good CPC looks like, and what the metric can and can’t tell you about B2B campaign performance.
LinkedIn Ads
Revenue Attribution & Measurement
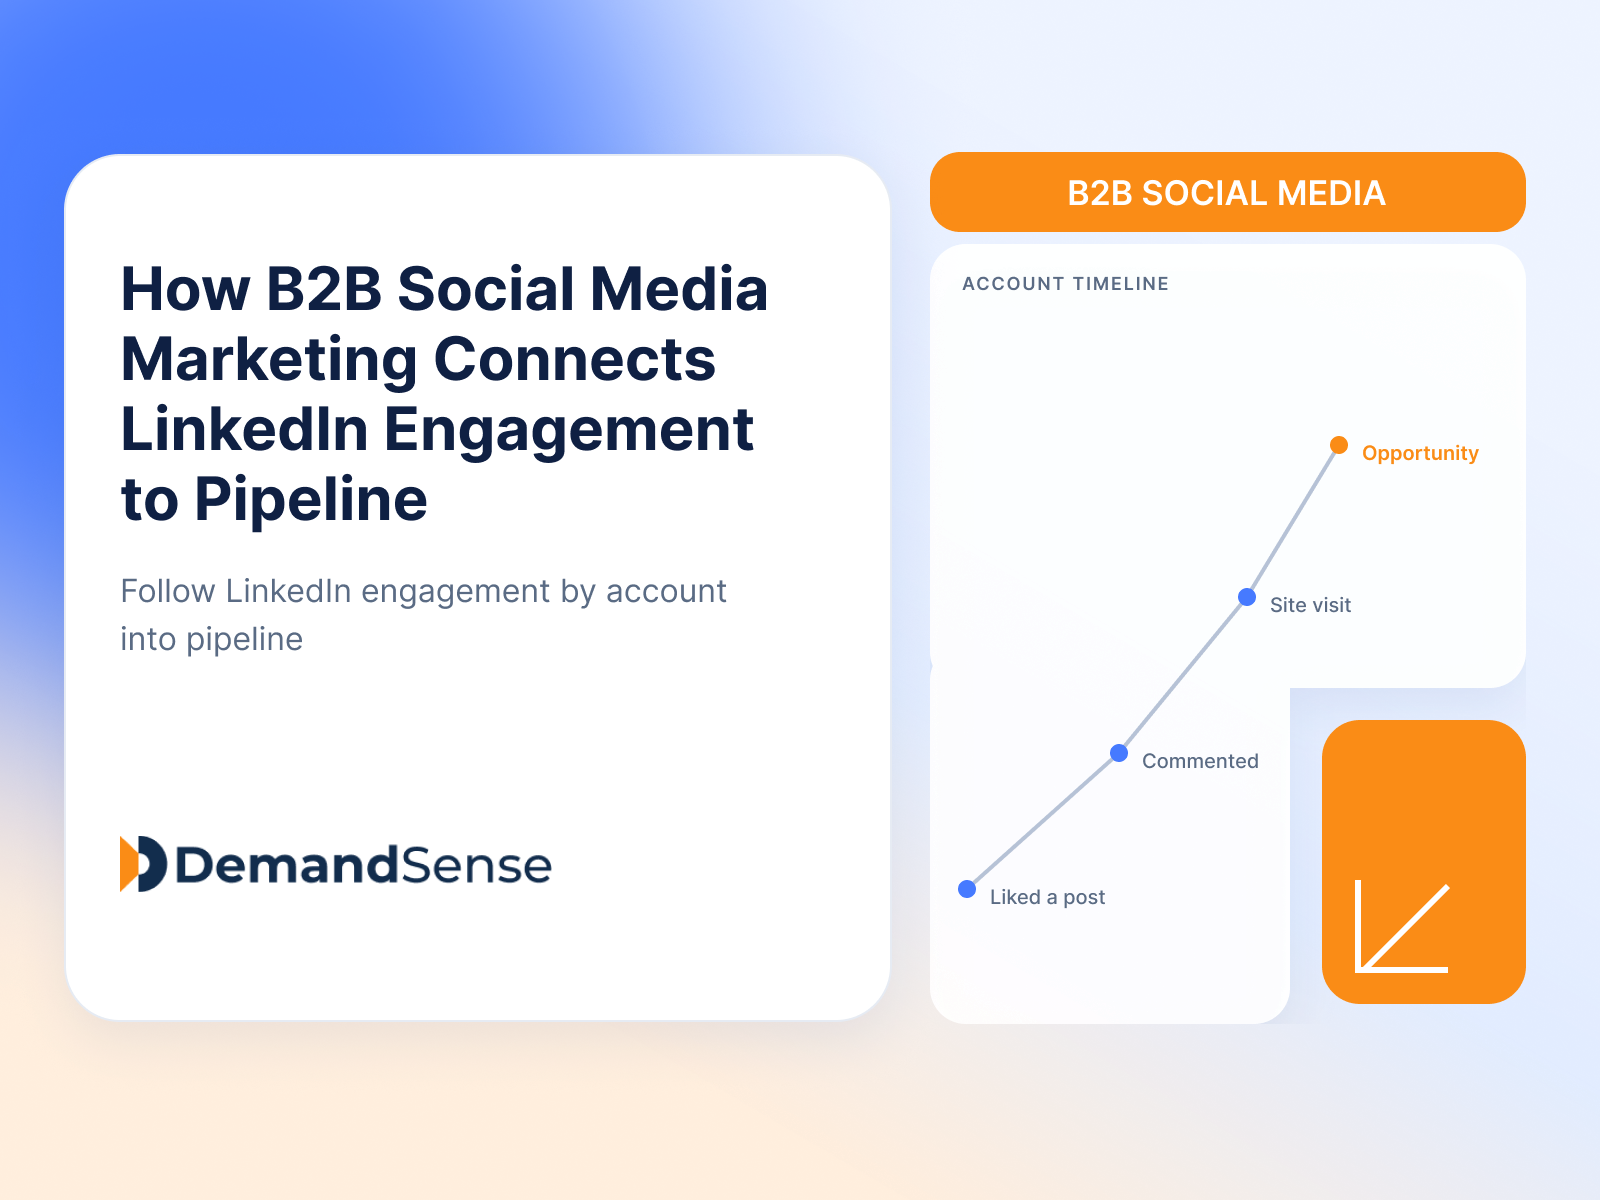
How B2B social media marketing works on LinkedIn: which platforms earn a place, what to post, and how to turn engagement into measurable pipeline.
LinkedIn Ads
Revenue Attribution & Measurement
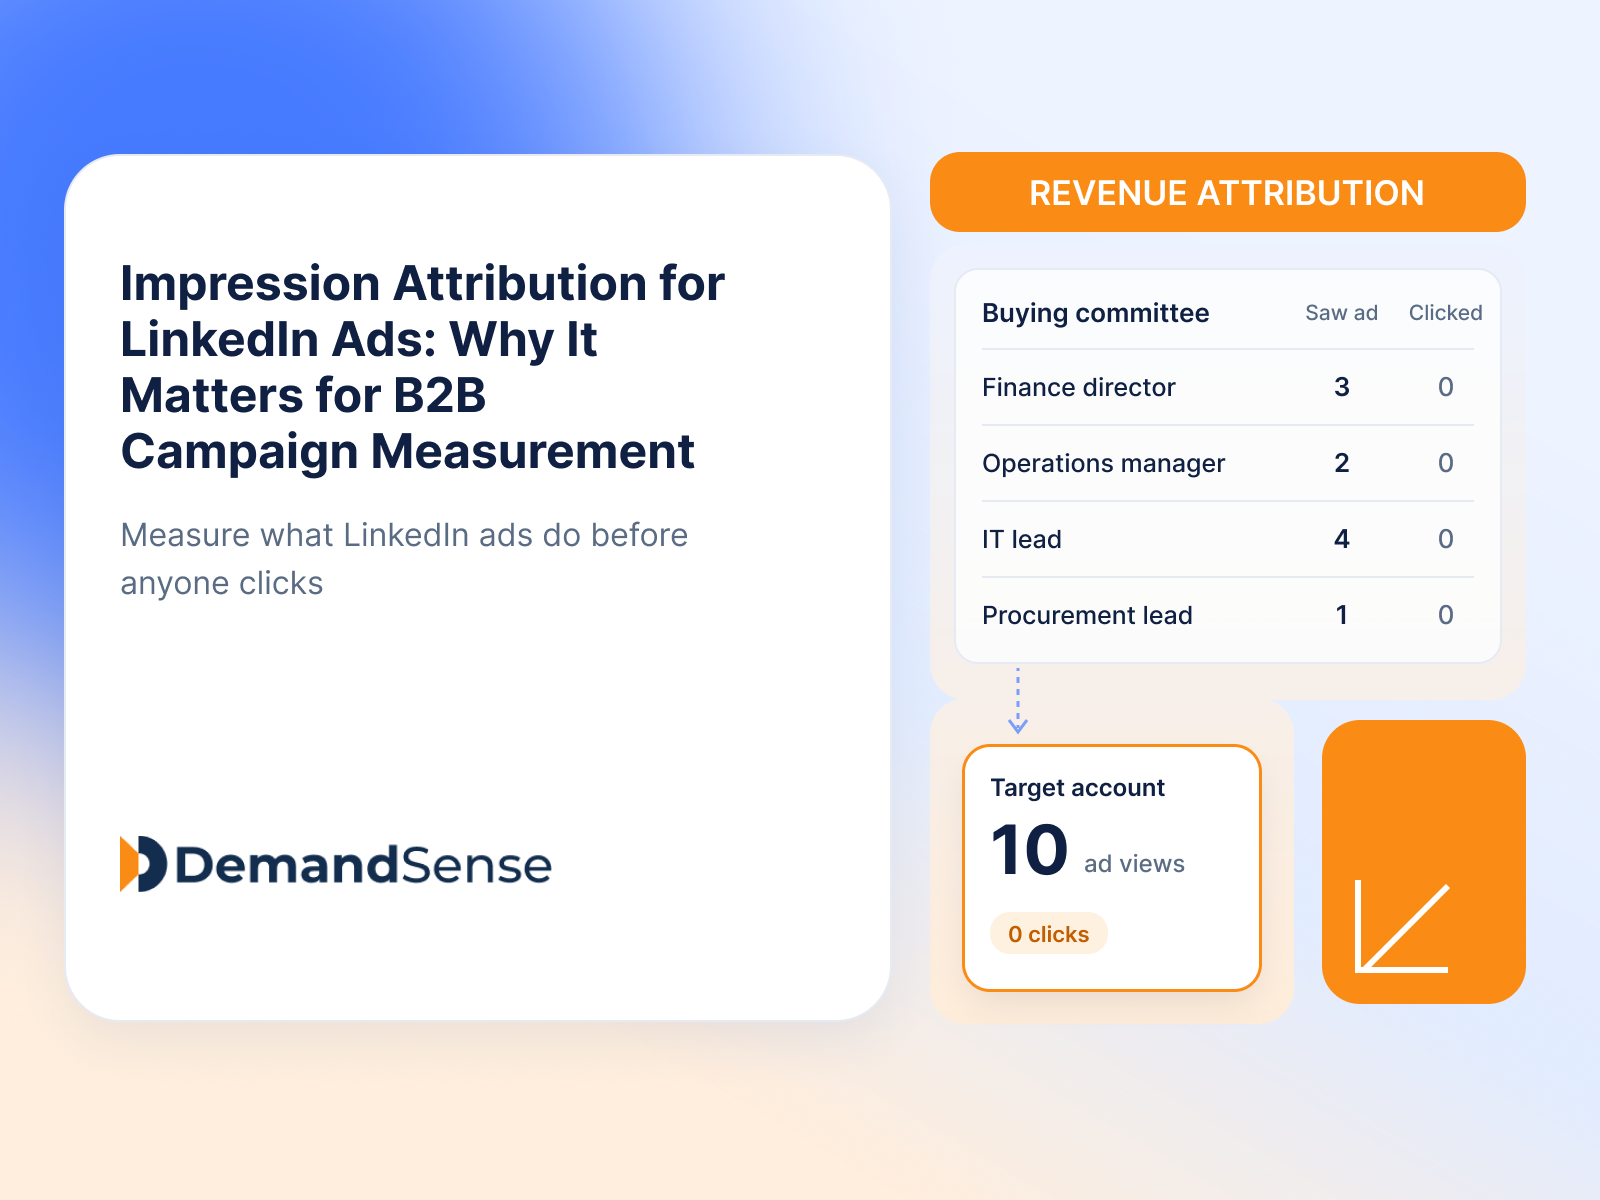
How LinkedIn impression attribution works, how it differs from click and view-through attribution, and what it reveals about B2B campaign performance.