LinkedIn Ads
Tools & Comparisons
Best LinkedIn Automation Tools for B2B Marketing and Ads
Compare LinkedIn automation tools for B2B marketing and ads: what each automates, how it connects to LinkedIn, which CRMs it supports, and what it costs.
LinkedIn Ads
Is a 0.5% CTR on LinkedIn good for your ad campaigns? The average CTR for LinkedIn ads is 0.52%, but a number sitting above or below that average cannot tell you whether your campaigns are influencing pipeline and revenue.
CTR is still worth tracking because it tells you whether your ads are relevant to your target audience — a high CTR means your audience is interested in what your ads are saying, while a low CTR means your ads are not capturing their attention.
However, a high CTR isn’t always a good sign, and a low CTR isn’t always bad either. To understand your ad performance, you need to evaluate CTR alongside other performance metrics like conversion rate, CPC, and engagement rate. In this article, we’ll take you through how to analyze these metrics together and improve campaign performance.
Here’s the short version before we get into the details:
CTR is an engagement metric that tells you how relevant your ad is to your target audience, which makes it a marketer’s favorite — everyone wants to see a high CTR on their ads.
The calculation is straightforward:
CTR = (chargeable clicks ÷ impressions) × 100
So if your ad has 90 clicks from 15,000 impressions, your CTR would be:
90 ÷ 15,000 × 100 = 0.6% CTR (which is already above average).
The catch is that “chargeable click” doesn’t mean the same thing on every campaign. LinkedIn defines chargeable clicks by campaign objective. On engagement and brand awareness objectives, social actions count — reactions, comments, shares, follows, and “See more” expands are all chargeable alongside clicks through to your site, which inflates the CTR you see on the Performance tab and can convince you your creative is working when it isn’t. On website visits and lead generation objectives, the chargeable click is the one you actually care about.
If you want to compare like with like across every campaign in your account, use clicks to the landing page. Campaign Manager won’t calculate that ratio for you, so do it manually: click on the ad you want to evaluate, open the Engagement tab to see Clicks to landing pages, then divide that by impressions.
Marketers should pay attention to CTR because it directly affects ad costs and delivery — LinkedIn limits your delivery when CTR is low, or charges you more to reach the same audience.
According to our 2026 LinkedIn B2B Benchmark Report, the average CTR for LinkedIn ads is 0.52%, while DemandSense clients average 0.875% across campaigns.
These are aggregate figures across B2B SaaS, IT, and professional services, so the average shifts depending on the industry you’re targeting, the ad format, and the funnel stage of the audience.
So if your CTR is below 0.52%, does that mean your ad sets are underperforming? And if it’s 0.6% or higher, does that mean your ads are great? Not necessarily.
An ad can have a high CTR and still be your worst performer, because if the clicks are coming from people outside your ICP, it won’t matter that you hit 1%. On the flip side, if your ad messaging is highly specific, it will filter out non-ICPs and reach the exact enterprise accounts you want — and it will have a low CTR, which is fine given the size of the deals at the end of it.
Before you make campaign decisions, treat the average as a starting point, then look at the rest of the picture: how does your CTR compare to similar campaigns targeting the same audience? Are the clicks turning into conversions? That’s what tells you whether to optimize CTR or leave the campaigns alone.
Your LinkedIn ad CTR can vary from industry averages because of ad format, target audience, competition for that audience, funnel stage, and ad frequency. Let’s look at each factor in detail.
Some ad formats see a higher CTR than others because of where they appear on the platform. Sponsored Content sees a higher CTR (0.40%–0.65%) than Text Ads and Dynamic Ads (0.025%), because Sponsored Content appears directly in the LinkedIn feed, while Text Ads and Dynamic Ads sit in the right rail where they’re easy to scroll past. Text Ads and Dynamic Ads are also desktop-only, so they never reach the mobile audience — which is how most people browse LinkedIn.
Message Ads (formerly Sponsored InMail) have the highest CTR in the category at 2%–3%, because they bypass the feed and land in the target audience’s inbox. The more relevant your content, the higher the CTR. Worth noting: Message Ads and Conversation Ads have restricted targeting for EU-based members, so this format isn’t available to every audience.
Because of these differences, it’s unreasonable to expect your Text Ads to hit the same CTR as your Sponsored Content or Message Ads. Only compare CTR between ads using the same format.
Your ads reach people at different stages of their buying cycle, and their perspective on your brand evolves as they move down the funnel.
Cold audiences may be indifferent to your ads and ignore them because they don’t trust you yet, so a low CTR at this point is normal. It’s usually more useful to focus on engagement rate at this stage, since it covers all the social actions — reactions, shares, follows, and comments — and gives you a fuller picture of how your audience is responding to your content.
A warm audience is more interested in what you have to say because they already know your brand, so you’ll often see a higher CTR from your retargeting campaigns than your prospecting campaigns.
If you judge prospecting and retargeting campaigns against the same aggregated LinkedIn benchmark, you may conclude that your awareness campaigns aren’t working and kill a perfectly healthy campaign, breaking the cycle that nurtures future buyers.
Chasing a higher CTR on awareness campaigns also pushes some advertisers toward tactics that damage pipeline further down the line. Here’s what that looks like in practice.
#### When a High LinkedIn Ads CTR Is Not a Good Result
Here’s a situation that surfaces in the paid-ads subreddits every few weeks. A marketer runs LinkedIn ads to promote their startup, and after a week the CTR sits at 2.8%. Impressive on paper.
But there are no conversions. The CTR is well above industry average, the targeting is tight and within ICP, and new creatives don’t move the conversion rate at all. The marketer is left wondering whether LinkedIn is simply an expensive platform or whether they’re missing something.
This is a good example of a high CTR signalling that your campaigns need optimization rather than that they’re working. If you find yourself there — high CTR, low conversion rate — it’s usually one of these:
All of these can make your CTR look healthy while conversion rates stay flat.
CTR also varies based on who sees your ads. If your targeting is specific and the audience is warm, your CTR will usually be high, because you can tailor the content to the needs of a narrow audience and the copy lands as relevant.
But if your targeting is broad and cold, you end up writing general ads that appeal to everyone and land with no one, so CTR drops.
Hyper-specific target audiences, like those in ABM campaigns, can also distort CTR. Because the audience is small, the impression count is small, and a handful of clicks can swing the number several tenths of a percent. This is why CTR shouldn’t be your primary metric for evaluating ABM campaigns — account-level engagement metrics are the better read.
The more often your audience sees the same ad, the less interested they become. A new creative can give you a high CTR that erodes as the campaign runs. So a low CTR doesn’t automatically mean your ads are bad or irrelevant — sometimes it’s a signal of creative fatigue.
Give new campaigns a week to collect enough clicks and impressions for CTR to stabilize, then watch frequency patterns throughout the campaign so your audience isn’t seeing the ads more often than necessary.
Some sectors — B2B SaaS, financial services, and healthcare among them — are highly competitive because of customer lifetime value. Everyone is bidding for the same buyers, so those buyers see a heavy volume of ads and grow selective about what they click. If you’re targeting these sectors, expect a lower CTR, while less saturated sectors like education tend to give you a higher one. Thought Leader Ads work well against competitive industries because they don’t read as ads.
Geography also affects CTR, since some markets respond better than others. The Netherlands, for example, can return a higher CTR than the UK or the US because it’s a smaller market with less competition and less ad saturation.
Don’t compare campaigns running in different geographic regions against the same industry benchmark.
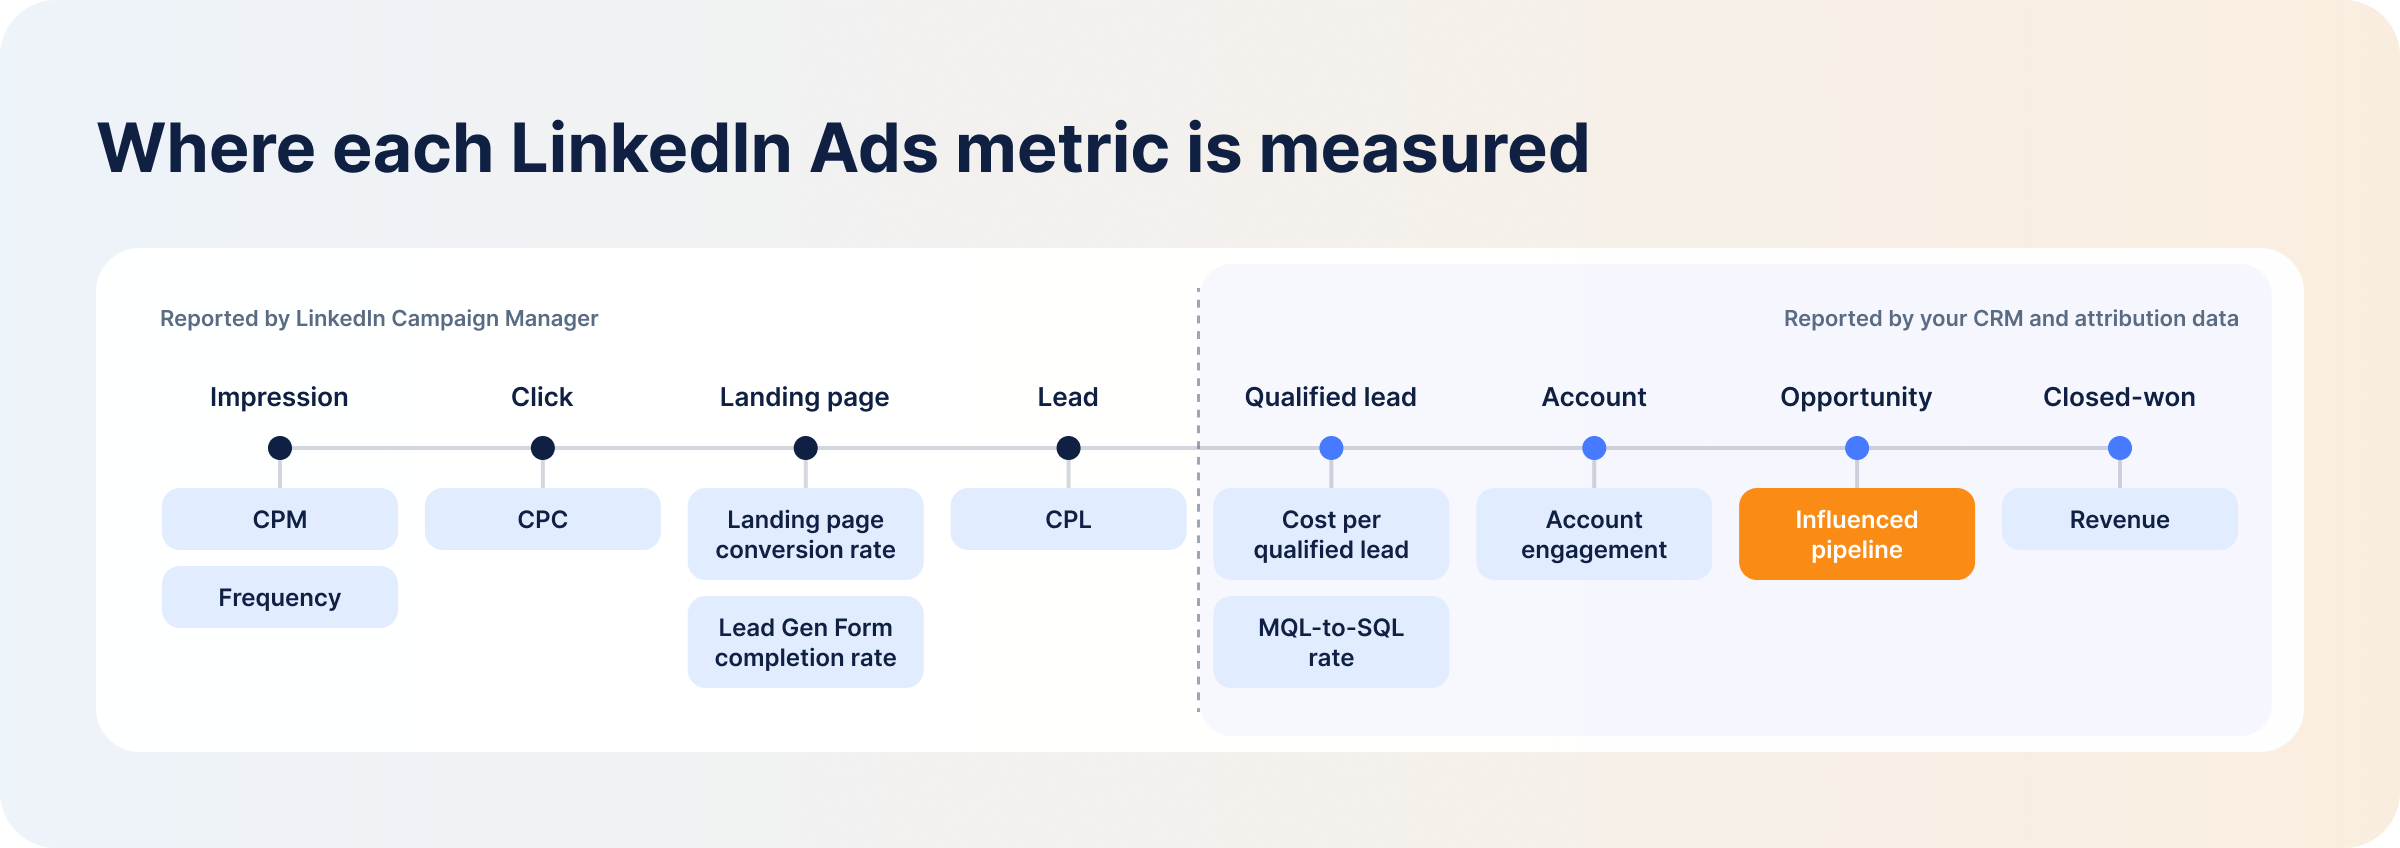
CTR alone can’t tell you how well campaigns are performing. Measure it alongside the metrics below, which split into two groups: performance metrics that tell you how a campaign is running right now, and pipeline metrics that tell you what it’s producing.
| Metric | What It Tells You | What It Can’t Tell You Alone |
|---|---|---|
| Performance metrics | Campaign health while the campaign is running | |
| CPC | What each click costs you | Whether those clicks are coming from your ICP |
| CPM | What you pay per 1,000 impressions | Whether the creative resonates with the people seeing it |
| Frequency | How often your audience sees your ad | Whether more exposure will improve performance or just annoy people |
| Landing page conversion rate | Whether your landing page offer and your ad offer match | Why visitors converted or dropped off — a slow page and an overlong form look identical here |
| Lead Gen Form completion rate | Whether there’s friction in the form stopping people from finishing it | Whether the data is accurate — most people autofill from their LinkedIn profile, which is often out of date |
| CPL | What it costs you to generate each lead | Whether you’re paying for quality leads |
| Pipeline metrics | What the campaign is actually producing | |
| Cost per qualified lead | What it costs you to generate a lead sales will accept | Whether those leads will convert or sit cold in the pipeline |
| Account engagement | Which target accounts are engaging with your ads | Which individuals inside those accounts are engaging, and whether they’re decision-makers or junior staff |
| MQL-to-SQL rate | Whether your campaigns are bringing in quality leads | How long it takes to close, or whether those SQLs become customers |
| Influenced pipeline | Which campaigns lead to open pipeline opportunities | What triggered the deal in the first place — check sourced pipeline for that |
| Revenue | The value of closed-won deals | Why the campaigns worked, or what resonated most with the audience |
Performance metrics help you monitor campaign health while campaigns are running, but they can’t tell you how those campaigns affect pipeline. Pipeline metrics can. You need both — one to keep the ads running well, the other to make informed decisions about where budget goes.
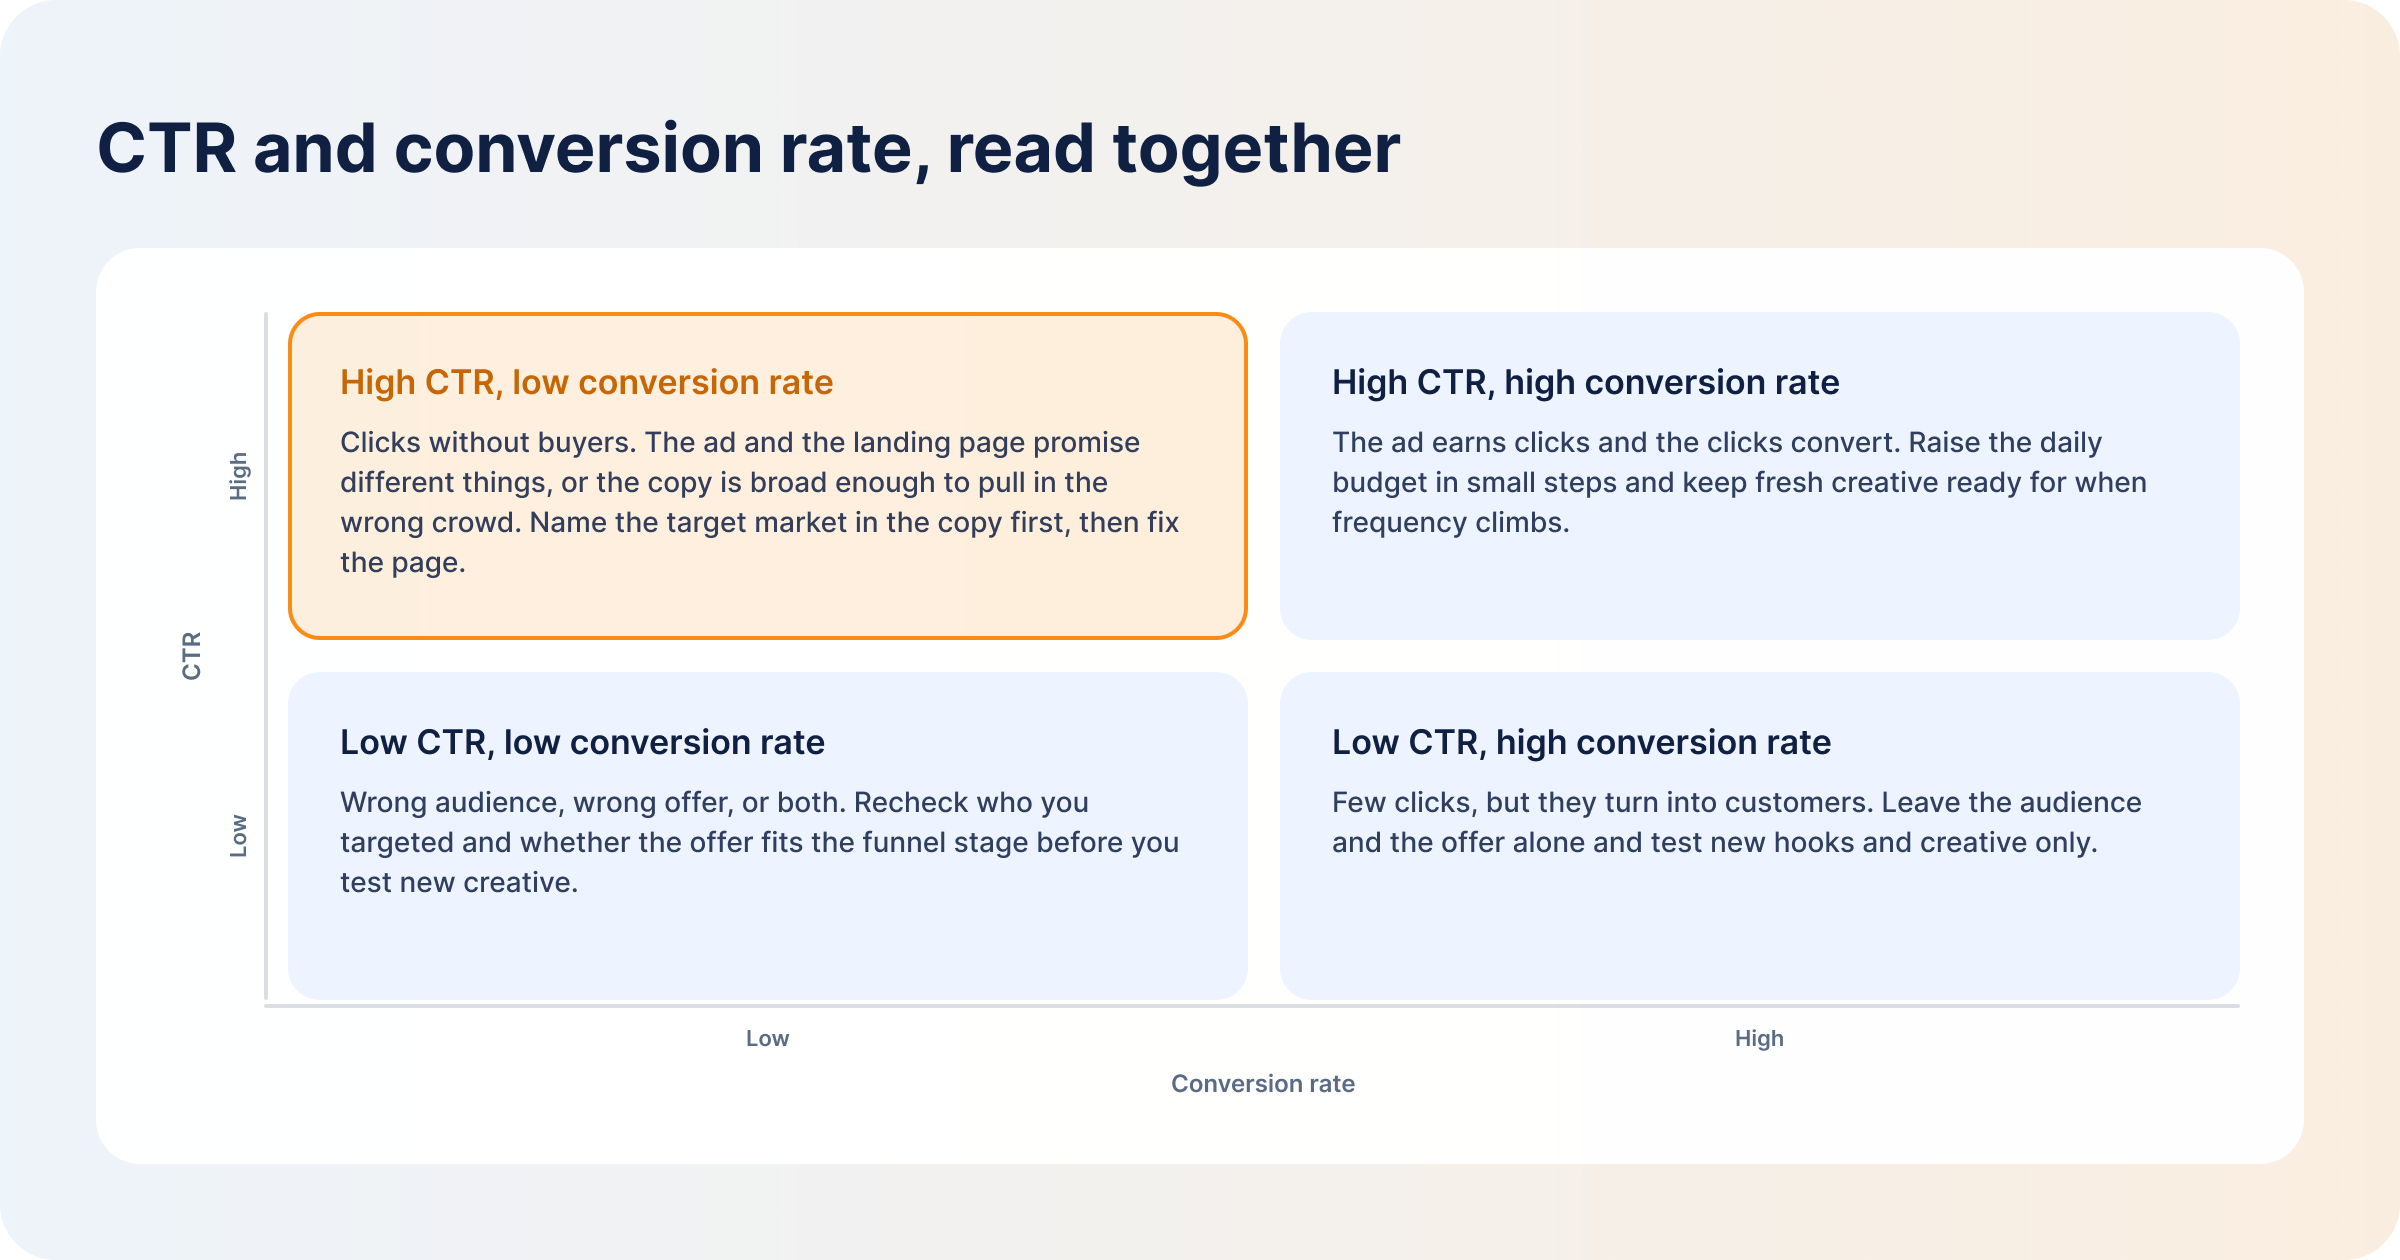
CTR on its own isn’t very useful, but CTR read together with conversion rate gives you real perspective on the buyer’s journey. Together they answer questions like: how many people turned into leads after seeing our ads, and where did the rest fall off?
Here’s how to read the two together.
| CTR ↓ / Conversion rate → | High conversion rate | Low conversion rate |
|---|---|---|
| High CTR | Your ad is working — sparking interest in the right people. Scale it gradually while watching frequency | Message–landing page mismatch, or the creative is overpromising. Make the messaging more specific to filter out curious onlookers |
| Low CTR | Tight targeting doing its job — don’t touch the audience, test new creatives but keep the offers that are converting | A genuine problem: wrong audience, wrong offer, or both |
Whenever you analyze CTR and conversion rate together, your campaigns will fall into one of these four quadrants. Let’s take each in turn.
High CTR + High Conversion Rate
This is the best case: your ads are relevant enough to earn clicks, they’re reaching the right people, those people are converting, and the landing page matches the ad offer. There’s nothing to change here except your budget.
Increase your daily budget once or twice a week, but don’t add too much at once — large jumps disrupt delivery and accelerate fatigue. Keep new creative variants ready so you can refresh before you lose the audience.
High CTR + Low Conversion Rate
This is the scenario from the Reddit example above: your ads are bringing in clicks, but none of them convert. If you look at CTR alone, you’d assume the ads are working. The question is whether those clicks are coming from the right people.
Compare your ad offer to the landing page offer to find the friction:
Sometimes the landing page needs the work, but more often the problem is the ad — it’s too general and pulling in the wrong crowd. Call out your target market explicitly in the copy. That will lower your CTR and improve the quality of the traffic.
Marketers in this quadrant often reach for native Lead Gen Forms to lift the conversion rate. If they fill out the form, they must be interested, right?
Removing the post-click step does improve the numbers, because LinkedIn autofills the form from the user’s profile. Our benchmark data puts the average Lead Gen Form open rate at 2.99% and the submission rate at 23.1% — better-looking than the 0.69% conversion rate on external websites. But it’s worth a reality check.
You’ve removed the friction, which also opens the door to people who want a quick download and have no intention of buying. Now sales has a longer list to chase and can’t close it, because some of those leads don’t remember filling out a form at all.
You also pay a premium for those leads: $810.83 CPL on native LinkedIn forms against $221.14 on external landing pages.
The takeaway: never change ad format to boost conversion when your messaging is the problem. You’ll attract the wrong crowd and spend more doing it. If you find yourself in this trap, sharpen the ad copy and tighten the targeting first.
Low CTR + High Conversion Rate
A low CTR here can make you believe your ads aren’t relevant, but the conversion rate says otherwise. This is common for niche campaigns targeting enterprise teams: you get very few clicks, and those few clicks turn into high-value customers.
There isn’t much that needs your attention. Test new creative hooks and angles, but leave the offer and the audience alone.
Low CTR + Low Conversion Rate
This is the worst case. Work through your campaign strategy to find the root cause:
From there, test new creatives with stronger hooks, different visuals, and different messaging angles to find what resonates. You can also analyze your competitor ads to see which copy angles and messaging work for your shared audience.
Segment by format, funnel stage, target audience, and individual creative before you judge anything, because CTR looks different across each. A campaign-level number is an average, and averages hide the creatives doing the work.
Check that the sample is large enough to mean anything. Don’t make decisions on a handful of impressions or clicks, especially in small ABM campaigns where a few extra clicks move the number.
Look at the trend rather than the snapshot. Is CTR improving, falling, or holding steady? If it drops suddenly after frequency increases, that signals creative fatigue, not irrelevance.
Read CTR alongside conversion rate to understand the post-click experience. Refer to the quadrant table above for what each combination tells you.
Only then decide what to change — offer, messaging, audience, landing page, or format.
A campaign can sit at the top of every efficiency benchmark and produce nothing, while a campaign with an unremarkable CTR carries the quarter — because the accounts it reached were the right ones.
With DemandSense revenue attribution, you can tell which ads bring in qualified accounts and which ones just add to the noise. You get:
Judge a campaign on its headline CTR and you miss most of what happened inside it.
Take one thought leader retargeting campaign from our own account. At campaign level it reports 4.30% CTR across 10,279 impressions — comfortably above benchmark, nothing to see here. Open the ads inside it and the twelve creatives run from 0% to 7.29%. Same audience, same targeting, same window. Creative is the only variable, and the campaign number is just an average of twelve very different results. The best creative is earning clicks at 1.7 times the rate of the campaign it sits in; three others are barely moving.
That spread is where your creative testing budget goes. DemandSense breaks CTR down per creative so you can see which hook and which image did the work when you change one variable at a time — and then reads that against the accounts each ad reached and the pipeline it influenced, so you can tell whether the winning creative won the right people or just the most people.
That is evidence you can take into the budget conversation while the campaign is still running: the answer to “is this working” comes with a list of engaged accounts attached instead of a click-through rate and a shrug.
Try DemandSense on your own campaigns, free for 30 days — no card needed.
Don’t lead with CTR on a small ABM audience — the number is unstable and a handful of clicks can swing it. Focus on reach, frequency, and account-level engagement instead, which tell you whether the ads are landing with the accounts you targeted.
No. LinkedIn advertisers reach a professional audience who aren’t on the platform to buy, so they click less often, which is why LinkedIn CTR runs lower. Search ads on Google typically carry the highest CTR of the three, because people arrive already searching for a solution. Compare each platform against its own benchmarks.
Sources differ on sample size and composition, date range, which industries are included, whether the figure is a mean or a median, the ad format mix, and how clicks are counted. That’s why you shouldn’t judge your campaigns against a source that doesn’t state its methodology.
Our 2026 LinkedIn B2B Benchmark Report uses aggregate data across B2B SaaS, IT, and professional services.
It depends on the campaign objective. On engagement and brand awareness objectives, chargeable clicks include social actions — reactions, comments, shares, follows, and “See more” expands — alongside clicks to your landing page, which pushes the CTR on the Performance tab above what your traffic numbers would suggest.
To evaluate CTR for website traffic specifically, calculate it manually: in Campaign Manager, click the ad you want to evaluate, open the Engagement tab to find Clicks to landing pages, then divide by impressions and multiply by 100.
Common causes: a cold audience, comparing against the wrong format’s benchmark, creative fatigue at high frequency, a weak hook, or targeting that’s too broad.
Sometimes a low CTR isn’t a problem at all. Before you rework your ad sets, check the conversion rate and account-level engagement to see whether the campaign is actually failing.
Book a personalized demo and discover how we can transform your B2B marketing.
See a quick demo videoLinkedIn Ads
Tools & Comparisons
Compare LinkedIn automation tools for B2B marketing and ads: what each automates, how it connects to LinkedIn, which CRMs it supports, and what it costs.
LinkedIn Ads
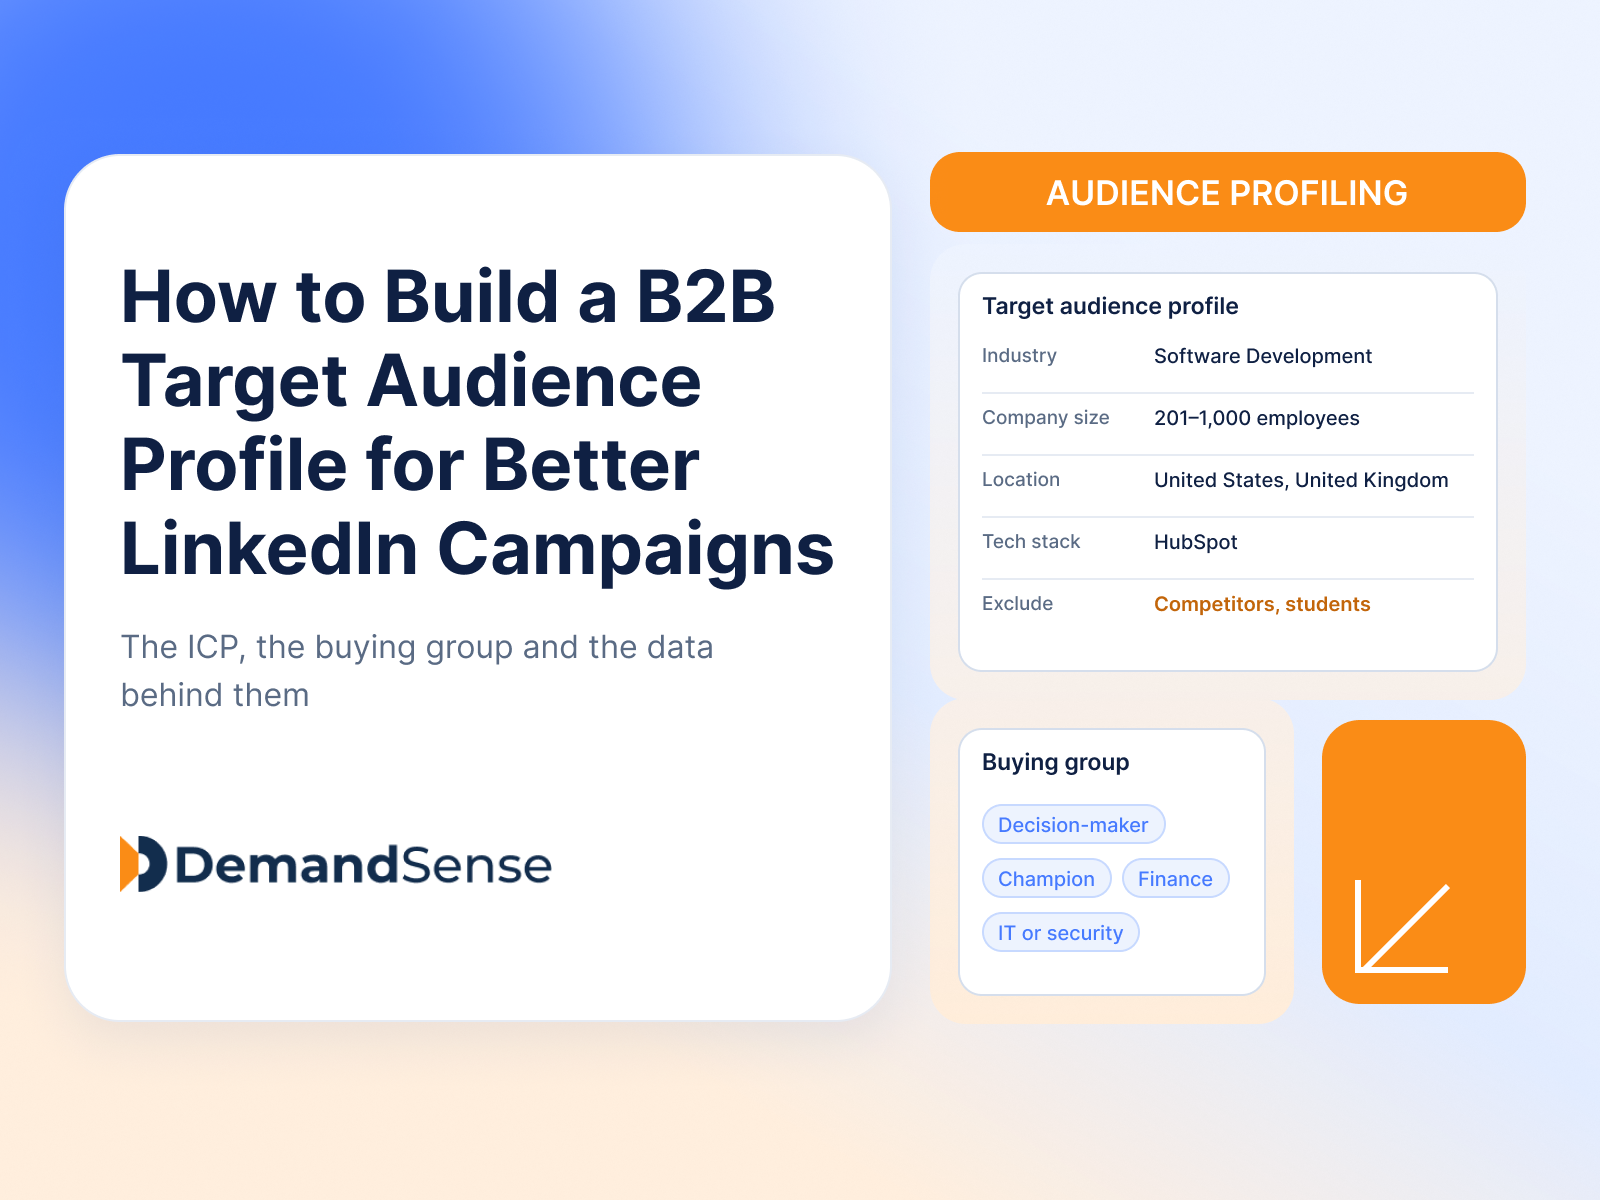
How to build a B2B target audience profile for LinkedIn Ads: the ICP, the buying group, the data that defines them, and how to turn it into campaigns.
LinkedIn Ads
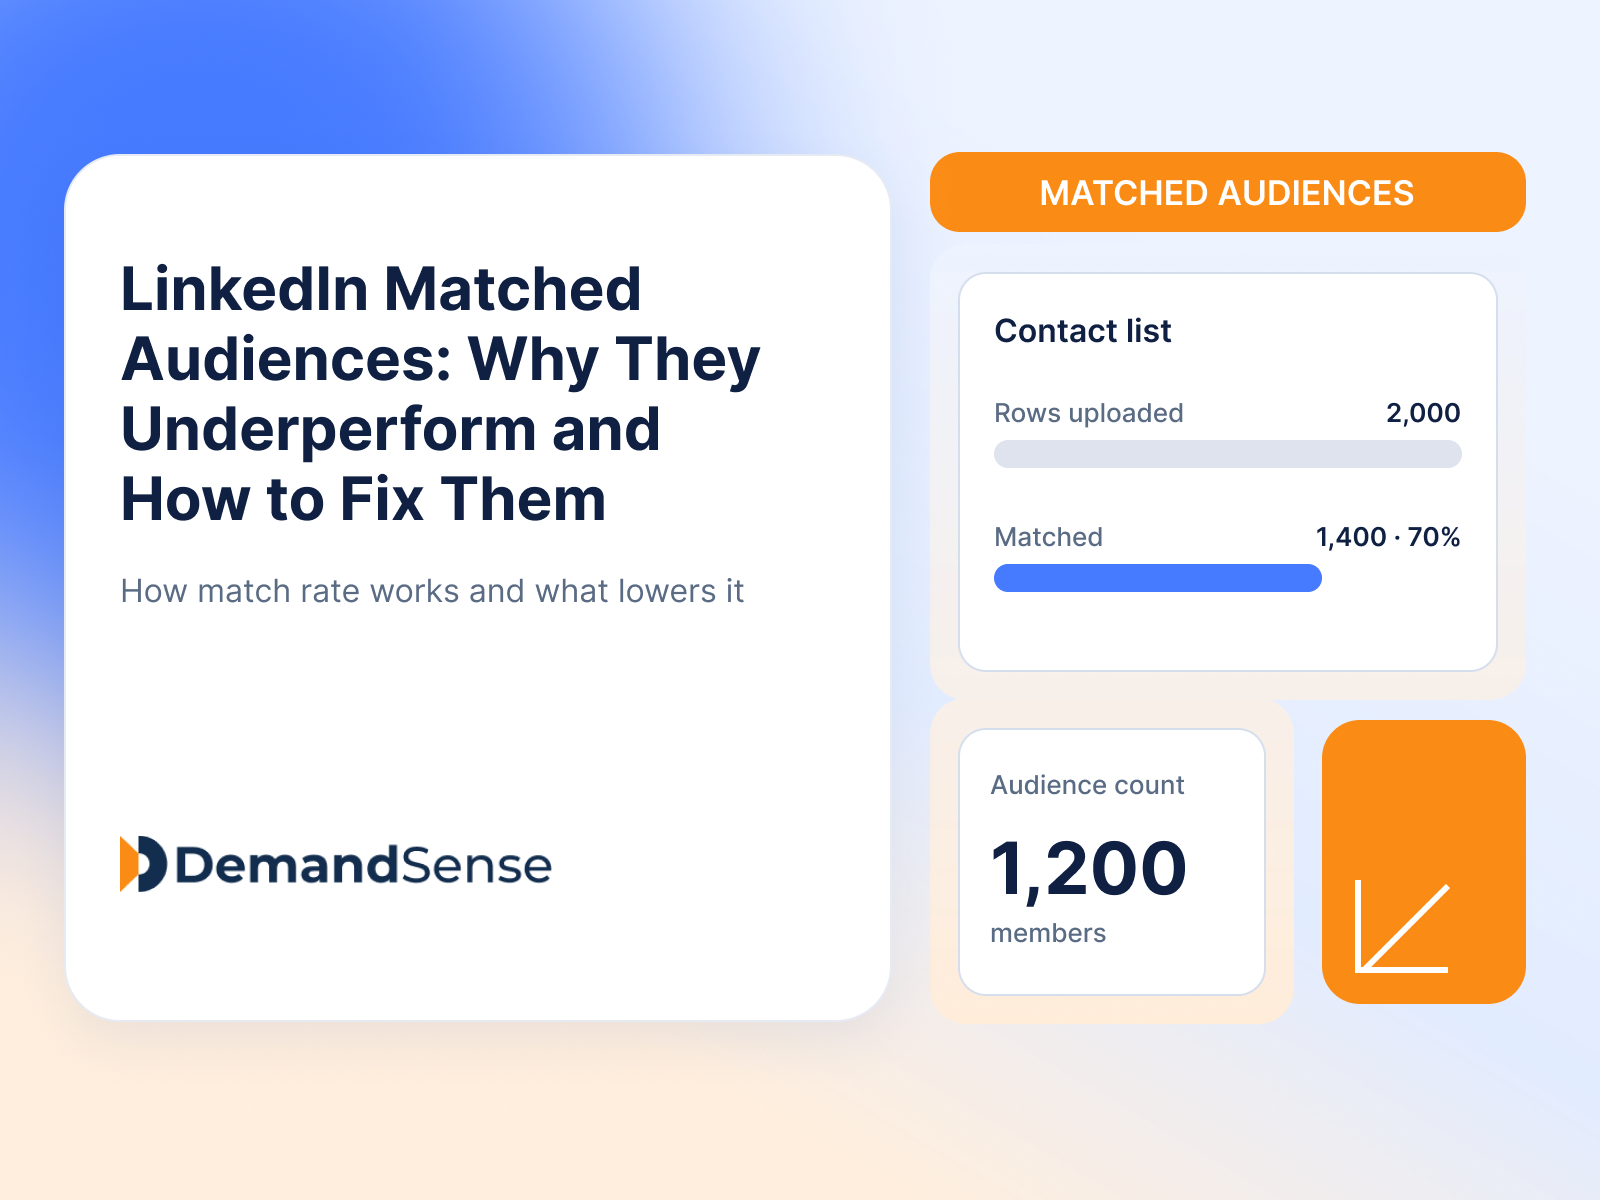
LinkedIn Matched Audiences often match less than you expect. How match rates work, why lists stall under 300, and what to fix before you launch.
Get expert insights and strategies delivered to your inbox weekly.
