••
Insights & Resources
Expert strategies, case studies, and best practices for B2B marketing teams.
Expert strategies, case studies, and best practices for B2B marketing teams.

AI reporting for LinkedIn Ads in a nutshell:
AI reporting for LinkedIn Ads is a workflow: you ask a question about your campaign data in natural language, and the AI answers with a summary, a table or a chart, plus an explanation of how it got the number.
Traditionally, marketers built these reports by hand. Export from Campaign Manager, build a pivot table in Excel, paste the numbers into a report, then write up what changed or what worked. Static dashboards help, but they only answer the questions someone thought to build a view for.
With AI reporting, you ask something like “Which campaigns reached the most accounts on our target list last quarter?” and the AI analyzes the data, summarizes campaign performance and explains what changed. Anyone on the team can do it, including people who have never written SQL.
“AI reporting” covers a wide range. At one end, you upload a CSV to a chat model. At the other, the model queries live, connected data for deeper analysis. The Three Ways section below walks through that range.
Key benefits include:
Generating AI reports is easy. The hard part is knowing what you want to find out, because generic questions get generic reports.
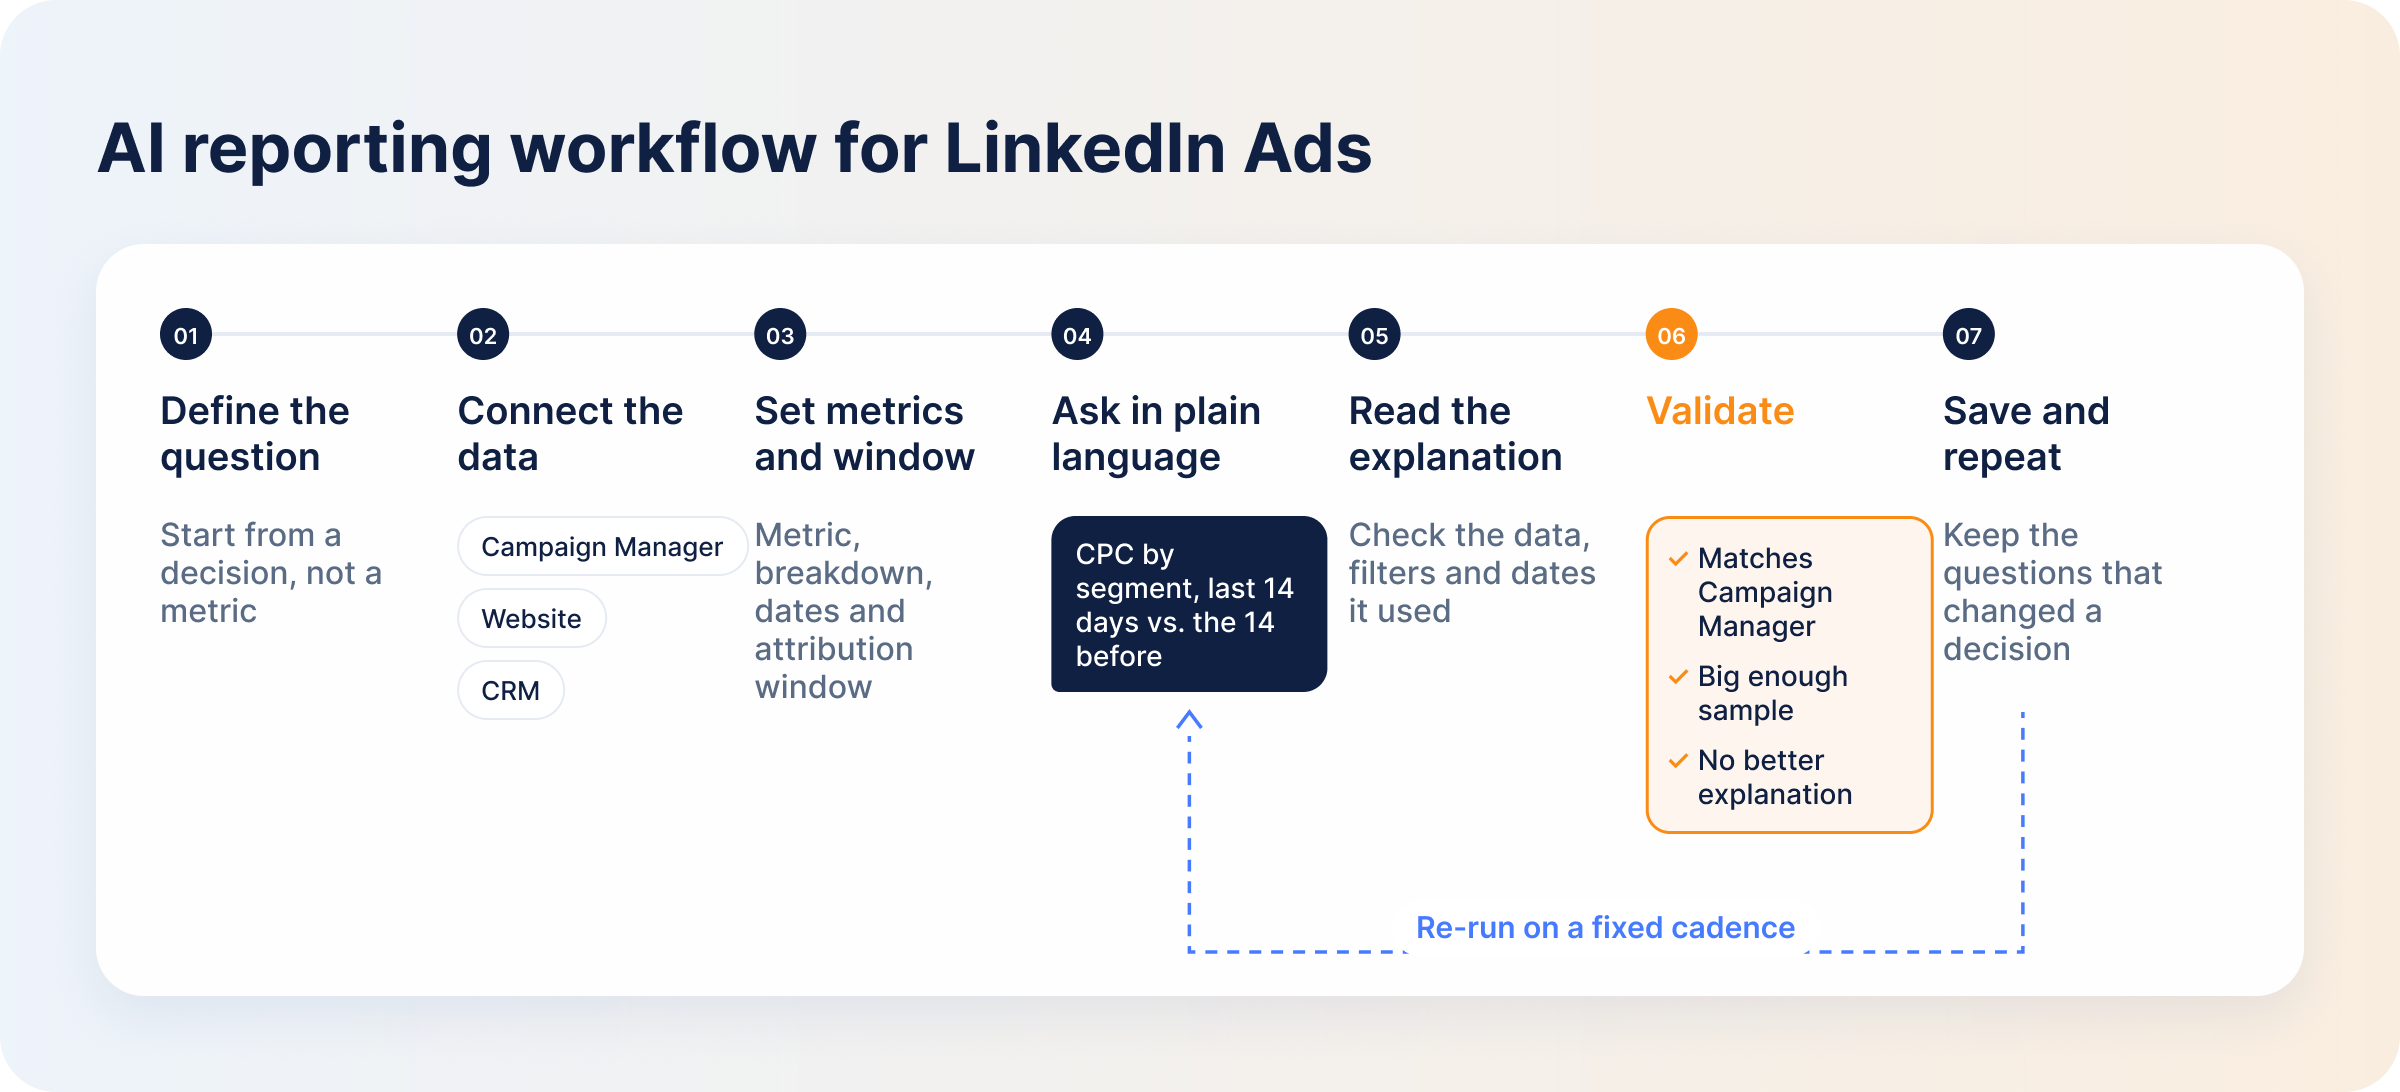
Start with the decision you need to make, not the metric. Is it about a campaign, an audience or an account?
“Show me CTR” gives you a number, not a report you can act on.
Most decision questions need more than one data source:
A question that spans two layers, like whether the accounts clicking your ads ever became opportunities, can’t be answered from one alone. You can provide the data as CSV exports or connect the AI to your systems directly; exports go stale as campaigns run and accounts move through the funnel.
Be clear about what you’re measuring and how the AI should break it down:
The attribution window is where most mismatches come from, because it decides which conversions get counted at all. Make it long enough to cover your sales cycle, so the report sees the whole buyer’s journey.
AI is very good at filling gaps with assumptions when instructions are vague, so keep your questions specific:
| Weak prompt | Strong prompt |
|---|---|
| Why is our LinkedIn ad spend so high? | Which audience segments had the biggest increase in cost per click over the last 14 days, compared with the 14 days before? |
| How did our campaigns perform last month? | Which campaign had the highest conversion rate among software companies last month, and how did its CPL compare with the account average? |
A strong prompt names the metric, the dimension, the date range and the comparison. Leave those out and the AI picks its own.
Check the explanation before the chart. It tells you what data the AI used, what it filtered out and what it assumed about the date range. A chart built on the wrong window looks exactly like one built on the right window.
If it doesn’t match the question you asked, prompt again with the missing detail spelled out.
AI can spot patterns quickly, but it doesn’t know your business context or your accounts, which is a big part of deciding what to automate and what to keep human. Run three checks before you act:
If the tool links to the source data behind an answer, even better.
Keep the questions that changed a decision and save them as templates. Standardize their wording and re-run them on a fixed cadence instead of writing a new prompt every time. Version the report too, so month-to-month changes are comparable. If you’d rather have a fixed view than a saved prompt, build a LinkedIn Ads reporting dashboard for it.
Most AI reporting tools are built for general use. For LinkedIn Ads, look for these AI capabilities:
You can upload raw data into a chat model, connect an AI tool to your data sources, or use a specialized platform built around LinkedIn attribution. Each has a legitimate use; they differ in how much data the AI can see.
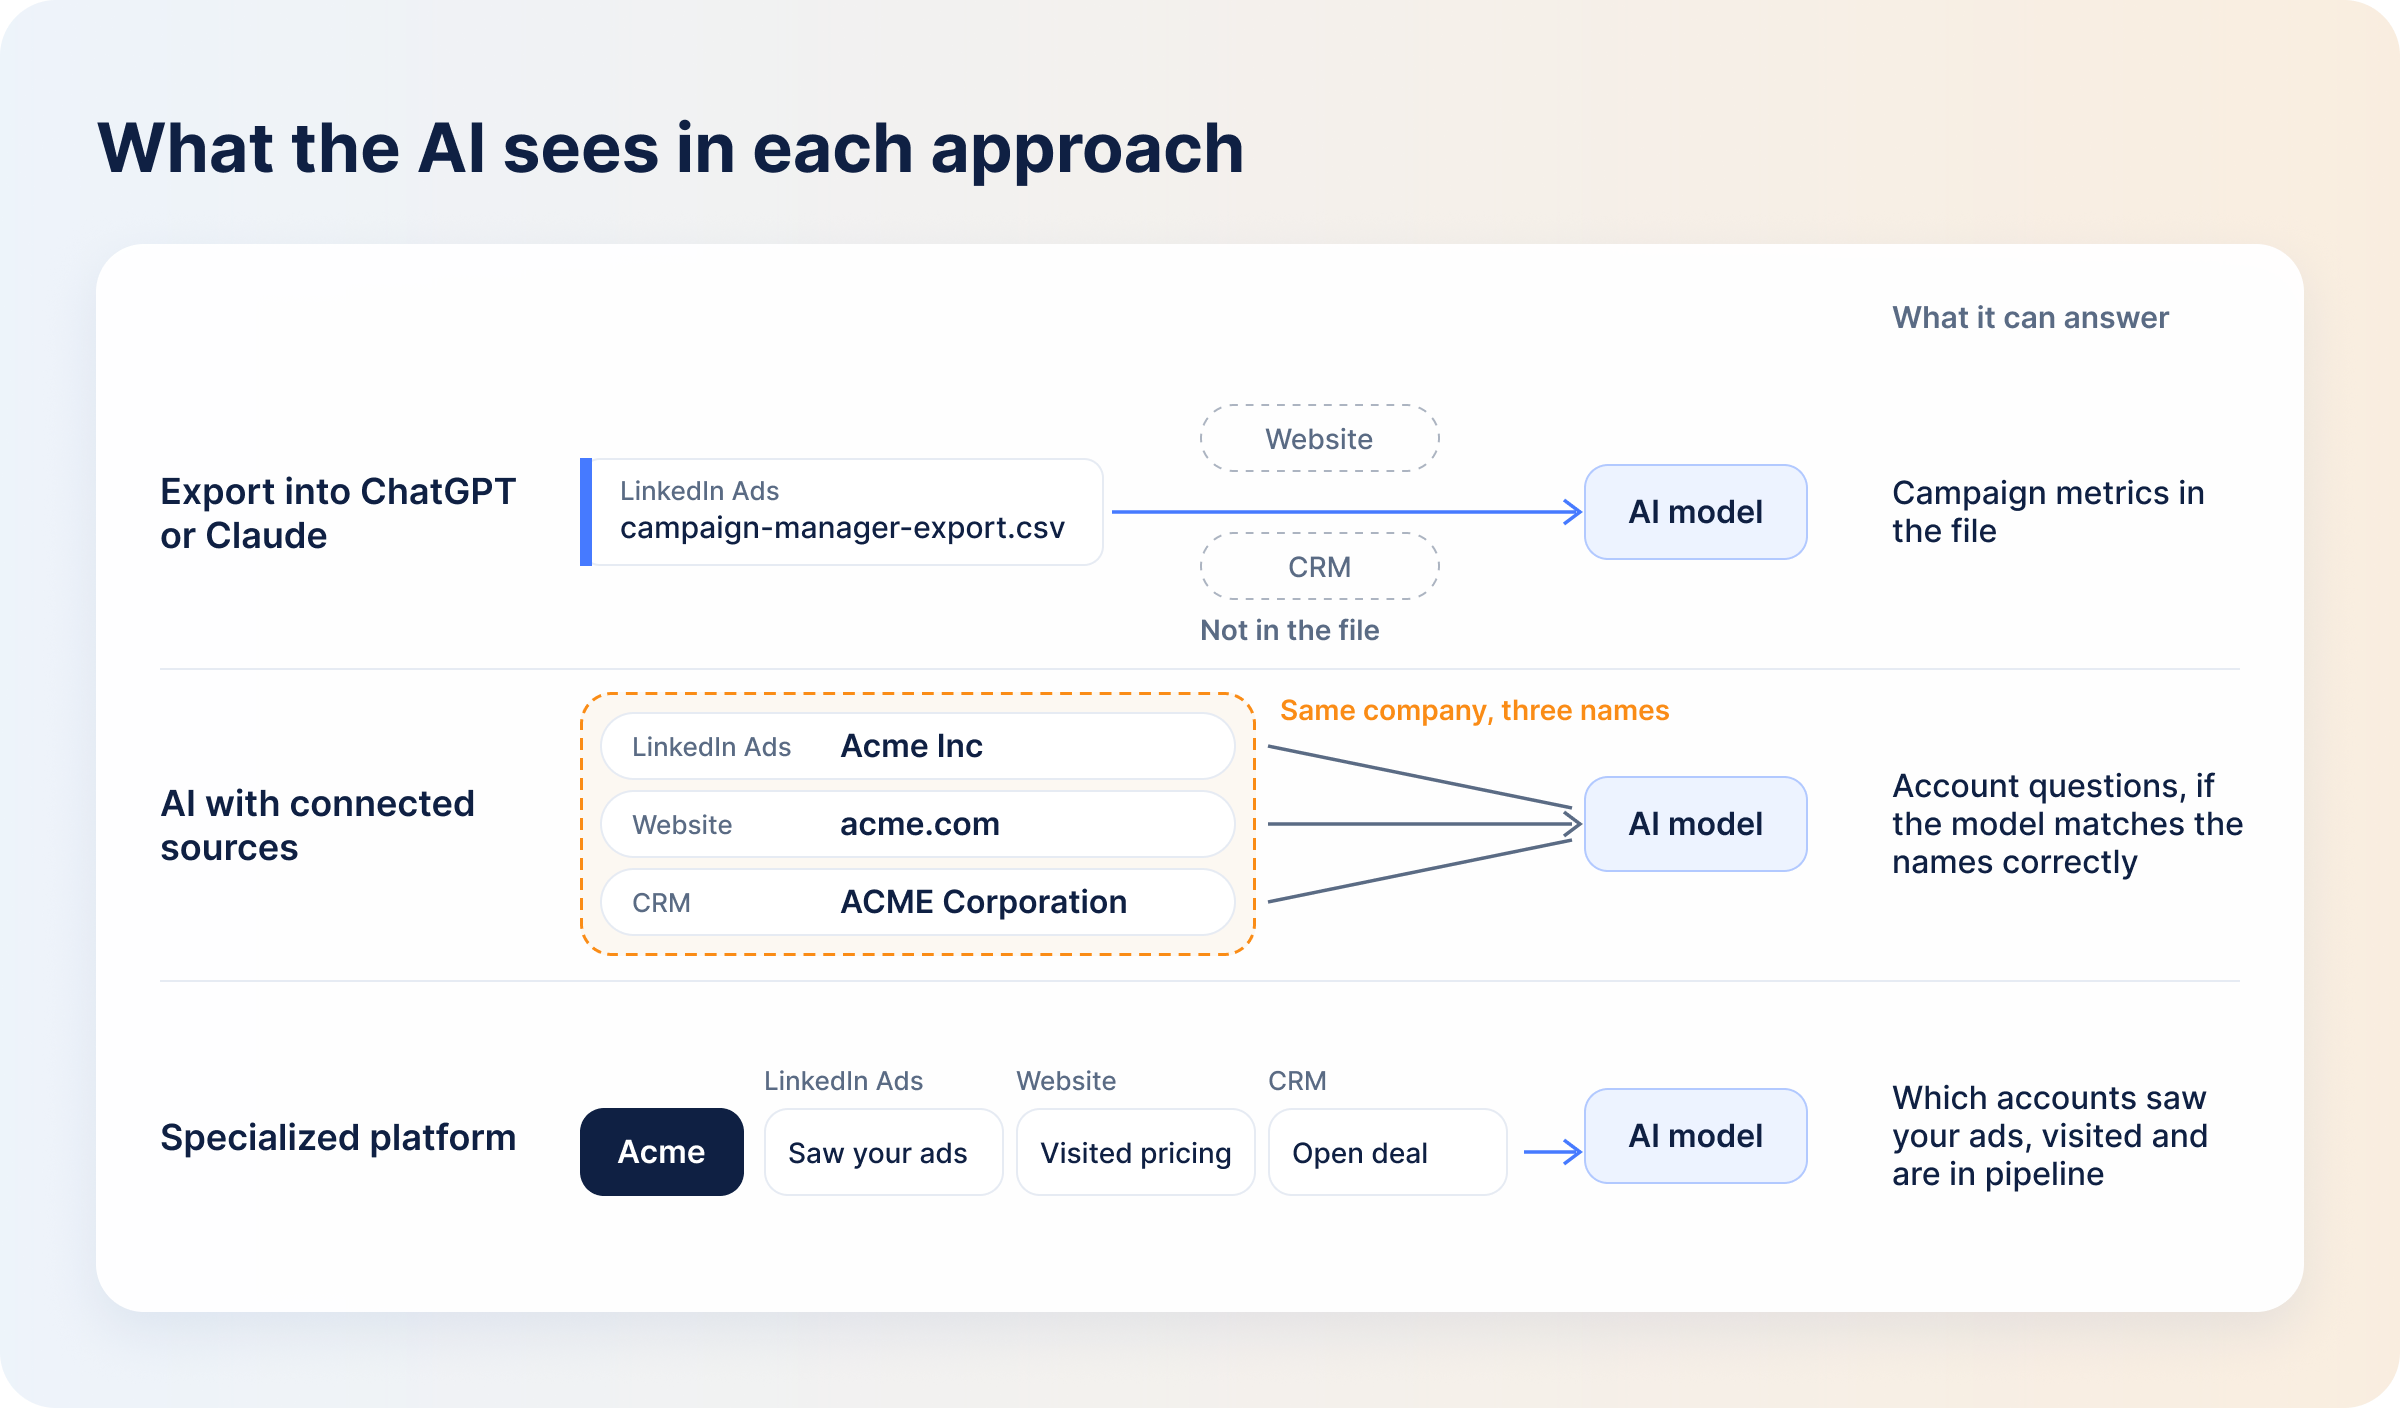
You can upload a Campaign Manager CSV export to ChatGPT or Claude, and the model will summarize it, chart it and write the narrative explaining it. That’s a real improvement over doing it by hand.
But the model can only see what’s in the file. There’s no website behavior, no CRM outcome and no account-level view beyond the company demographics LinkedIn already exports. And you have to redo the analysis every month from a fresh export.
Here the model queries live data through connectors instead of a file, so there’s no re-uploading, and answers are as fresh as the last sync.
The catch is matching the sources up. If ad, website and CRM data arrive through three separate connectors, the model has to line them up itself, on keys that don’t agree: a company name spelled three ways, people in one system and accounts in another. That’s where answers go wrong.
DemandSense MCP works differently: DemandSense reads LinkedIn ad exposure, identified website visitors and CRM state side by side before Claude or ChatGPT asks anything, so the model isn’t left to reconcile three sources on its own.
Many B2B attribution and intelligence platforms now have AI built in. The data model, attribution logic and account matching are already in place, so you get structured answers about how ads influence pipeline and revenue without building that layer yourself.
The trade-off is scope: the AI answers only within what the platform models, whether that’s LinkedIn-first or general multi-touch, and how it maps leads to accounts. If LinkedIn is your main paid channel, a LinkedIn-first platform will usually model it in more depth.
All three approaches work, and the right one depends on your questions:
| Approach | Data Access | Setup | LinkedIn Ads Context | CRM & Pipeline Context | Recurring Reporting | Best For |
|---|---|---|---|---|---|---|
| ChatGPT / Claude with exports | Manual CSV uploads | None: sign in and upload a file | Only what’s in the file | None, unless you upload a CRM export too | Re-upload the data and re-ask | One-off questions and quick analysis |
| AI with connected data | Live connectors to ad, website and CRM sources | Connect each source, usually through MCP servers | Yes, but without a LinkedIn-specific data model | Yes if the CRM is connected, but the model does the matching | Re-run the saved prompt | Teams with centralized data that run the same analysis repeatedly |
| Specialized LinkedIn Ads platform | LinkedIn Ads plus the other sources the platform supports | Native CRM integrations or webhooks | Deep | Pipeline and revenue traced back to campaigns and accounts | The platform’s own report scheduling | B2B teams that need LinkedIn reporting tied to accounts, pipeline and revenue |
Whichever you use, report quality depends on the data underneath, so resolve mismatches before you plug in the AI.
AI reporting tools for B2B marketing range from LinkedIn-first platforms to broad attribution suites. These are the AI reporting tools in 2026 worth knowing:
| Tool | Best For | AI Reporting & Analytics Strength | LinkedIn Ads Data Approach | Key Limitation |
|---|---|---|---|---|
| DemandSense | LinkedIn-first B2B teams | AI Co-Pilot answers plain-English questions with a chart; DemandSense MCP gives Claude and ChatGPT read-only access to ad, visitor and CRM data | Identifies website visitors (companies and people), shows which saw your ads, and ties them to CRM pipeline and revenue | LinkedIn-first; audience activation is LinkedIn-only |
| HockeyStack | Enterprise GTM teams | Odin, an AI analyst, answers in plain language; an Evaluation Agent cross-checks it against source data | Connects LinkedIn Ads with CRM, marketing automation, website and other ad platforms | Built for enterprise scale; custom pricing |
| Dreamdata | Complex, multi-touch B2B sales cycles | Analytics Agent shows the metrics, filters, dates and attribution model behind each answer; MCP server on paid plans | Cost, impressions, clicks, visitors, companies, influenced deals, CPA and ROAS | LinkedIn is one channel among many; data warehouse is an add-on |
| Factors.ai | ABM and multi-touch attribution | Scout answers pipeline questions and builds reports on demand; Factors MCP connects Claude and ChatGPT | LinkedIn AdPilot shows which accounts viewed or engaged with your ads | Broad ABM suite, so reporting is one module among several |
| CaliberMind | Enterprise GTM teams with mature data stacks | Ask Cal answers marketing and sales questions in plain language | Marketing and sales data in one buyer-journey view, on its own managed warehouse | Built for RevOps and marketing ops teams |
| ZenABM | LinkedIn ABM | Zena AI agent; MCP server on Pro and Agency plans | Company-level LinkedIn engagement, plus Google, Reddit, organic and AI chatbot touchpoints | Website visitor identification needs a separate tool |
| SegmentStream | Cross-channel attribution and budget allocation | Machine-learning Visit Scoring predicts each visitor’s likelihood to convert | LinkedIn measured inside cross-channel attribution, with geo-holdout incrementality tests | Built for ecommerce as much as B2B |
Set your goals first, then pick the tool that fits them. Six of these also get a full write-up in our comparison of B2B marketing intelligence platforms.
AI has made reporting easier, but it still needs a human checking the work, because:
Best practices:
Take a pipeline-level question like “Which CRM accounts went quiet but keep visiting the site after seeing our ads?” Generic AI tools struggle with it because the answer sits in three systems at once, and even with all three connected, the model has to line them up on keys that don’t match.
DemandSense MCP reads those three streams side by side before Claude or ChatGPT asks anything: LinkedIn ad exposure at the impression level, identified website visitors at the person and company level, and CRM state. It’s read-only, so the model answers questions and changes nothing in your ad account. The setup is a few steps, covered in our guide to analyzing LinkedIn Ads with Claude.
Inside the app, the AI Co-Pilot answers plain-English questions about your LinkedIn, Google and Facebook ads and your website visitors, with a chart alongside the answer. For the recurring piece, the Reporting module lets you build a client report once, share it with stakeholders who don’t have a login, and see whether they opened it.
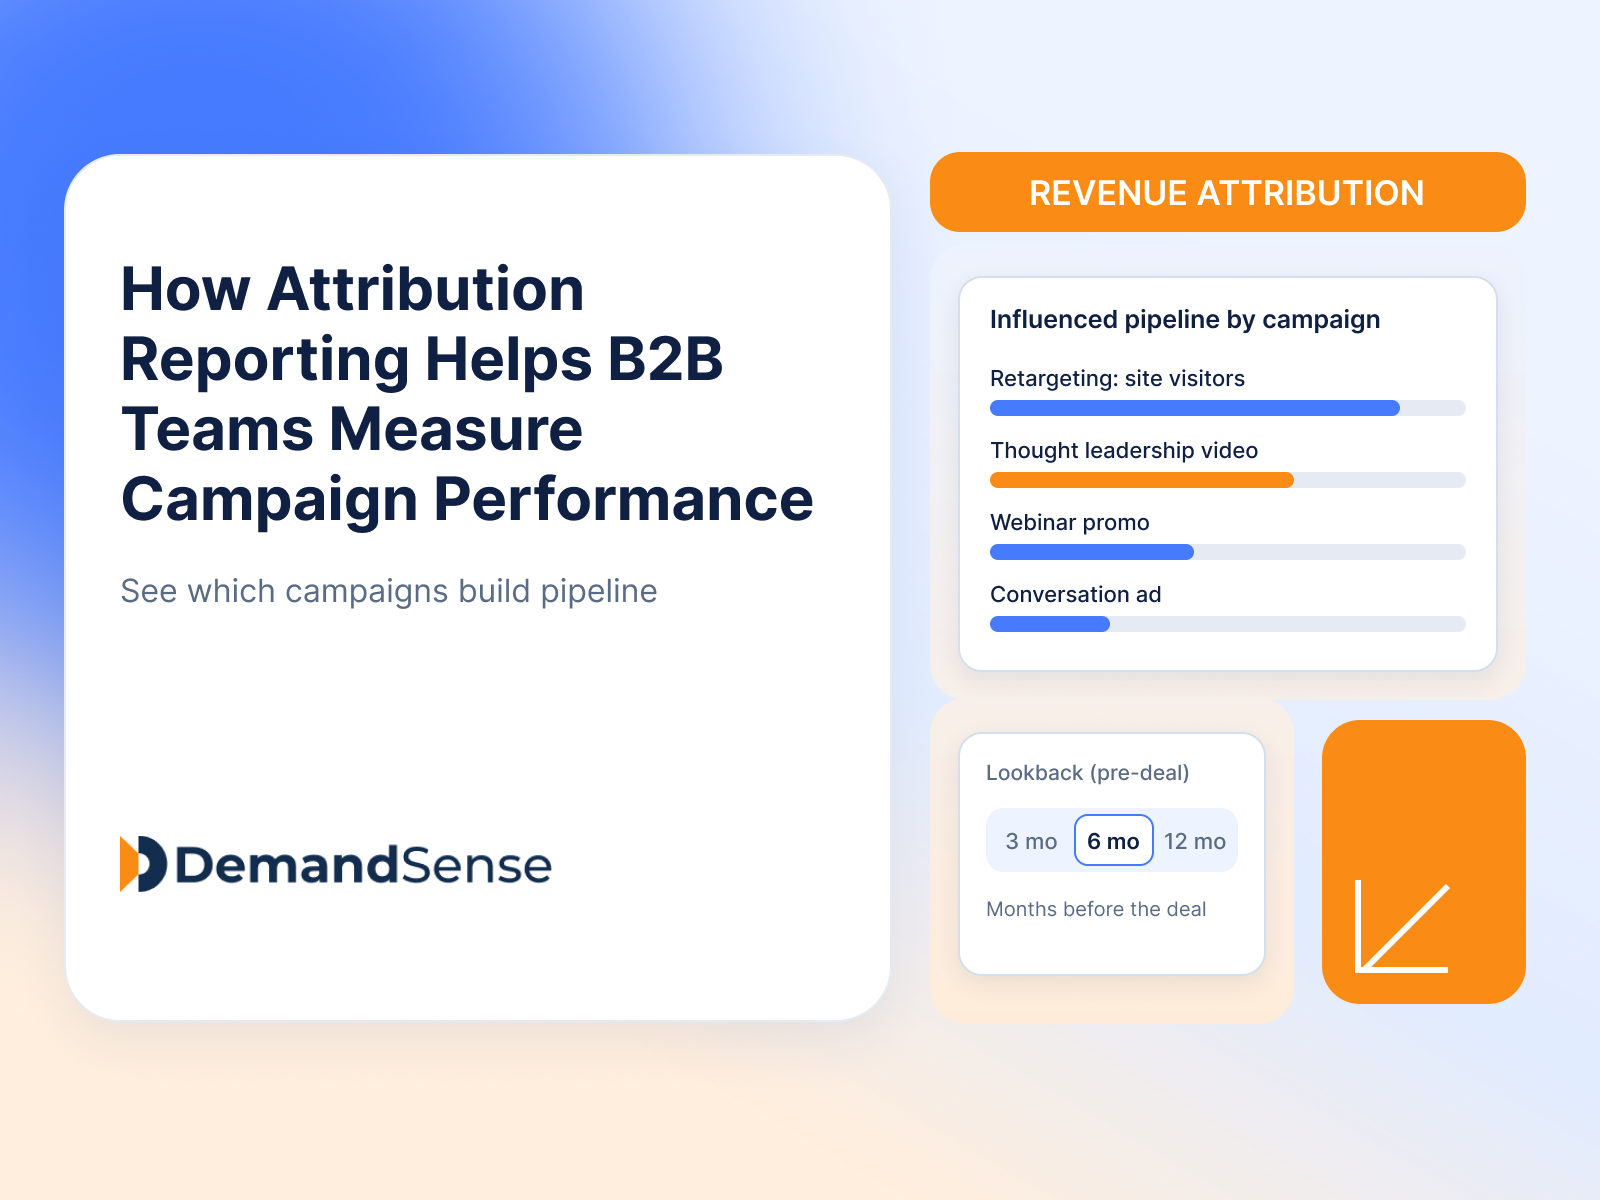
Revenue attribution lets you define what counts as influenced, with three presets (Awareness, Engagement and Intent) and a 3-, 6- or 12-month lookback, and Won ROAS shows which campaigns to back. You install DemandSense yourself through Google Tag Manager.
MCP comes with every DemandSense plan and with the 30-day free trial, no card needed. Start at demandsense.com/mcp-intelligence-hub.
Yes. It summarizes, charts, explains, spots a campaign that’s off-trend and turns the export into a readable performance report. But it’s limited to what’s in the CSV file, and the file is a snapshot: no website behavior and no CRM outcome. To query those as well, you can connect ChatGPT to LinkedIn Ads through an MCP server.
The data should cover at least one full sales cycle and one full budget cycle, so seasonality and end-of-quarter pushes are included. Fewer clicks mean wider error bars on anything the AI tells you, so don’t judge campaigns on a few clicks or a short attribution window.
It works, but you risk over-reading it. Small datasets suit directional questions like “which audience segments are engaging with our ads at all,” not precision questions like “which creative has the better conversion rate?” Always look at the filters and source data to validate a report before acting on it.
Yes, and this is where plain-language explanations earn their keep, since non-technical teams can read them without a walkthrough. Before sharing, strip the model’s hedging and restate the date range and attribution window in the report header, so readers know what they’re looking at. In DemandSense, the Reporting module sends reports to people who don’t have a login.
Find the source of the mismatch. Check these in the order they usually turn up: date range and time zone; attribution window and click-versus-view conversions; data freshness (when the connected source last synced); filters the model applied without telling you; currency and rounding. If none of these explains it, trust Campaign Manager for delivery metrics and re-ask the question with the filters spelled out.
Book a personalized demo and discover how we can transform your B2B marketing.
See a quick demo video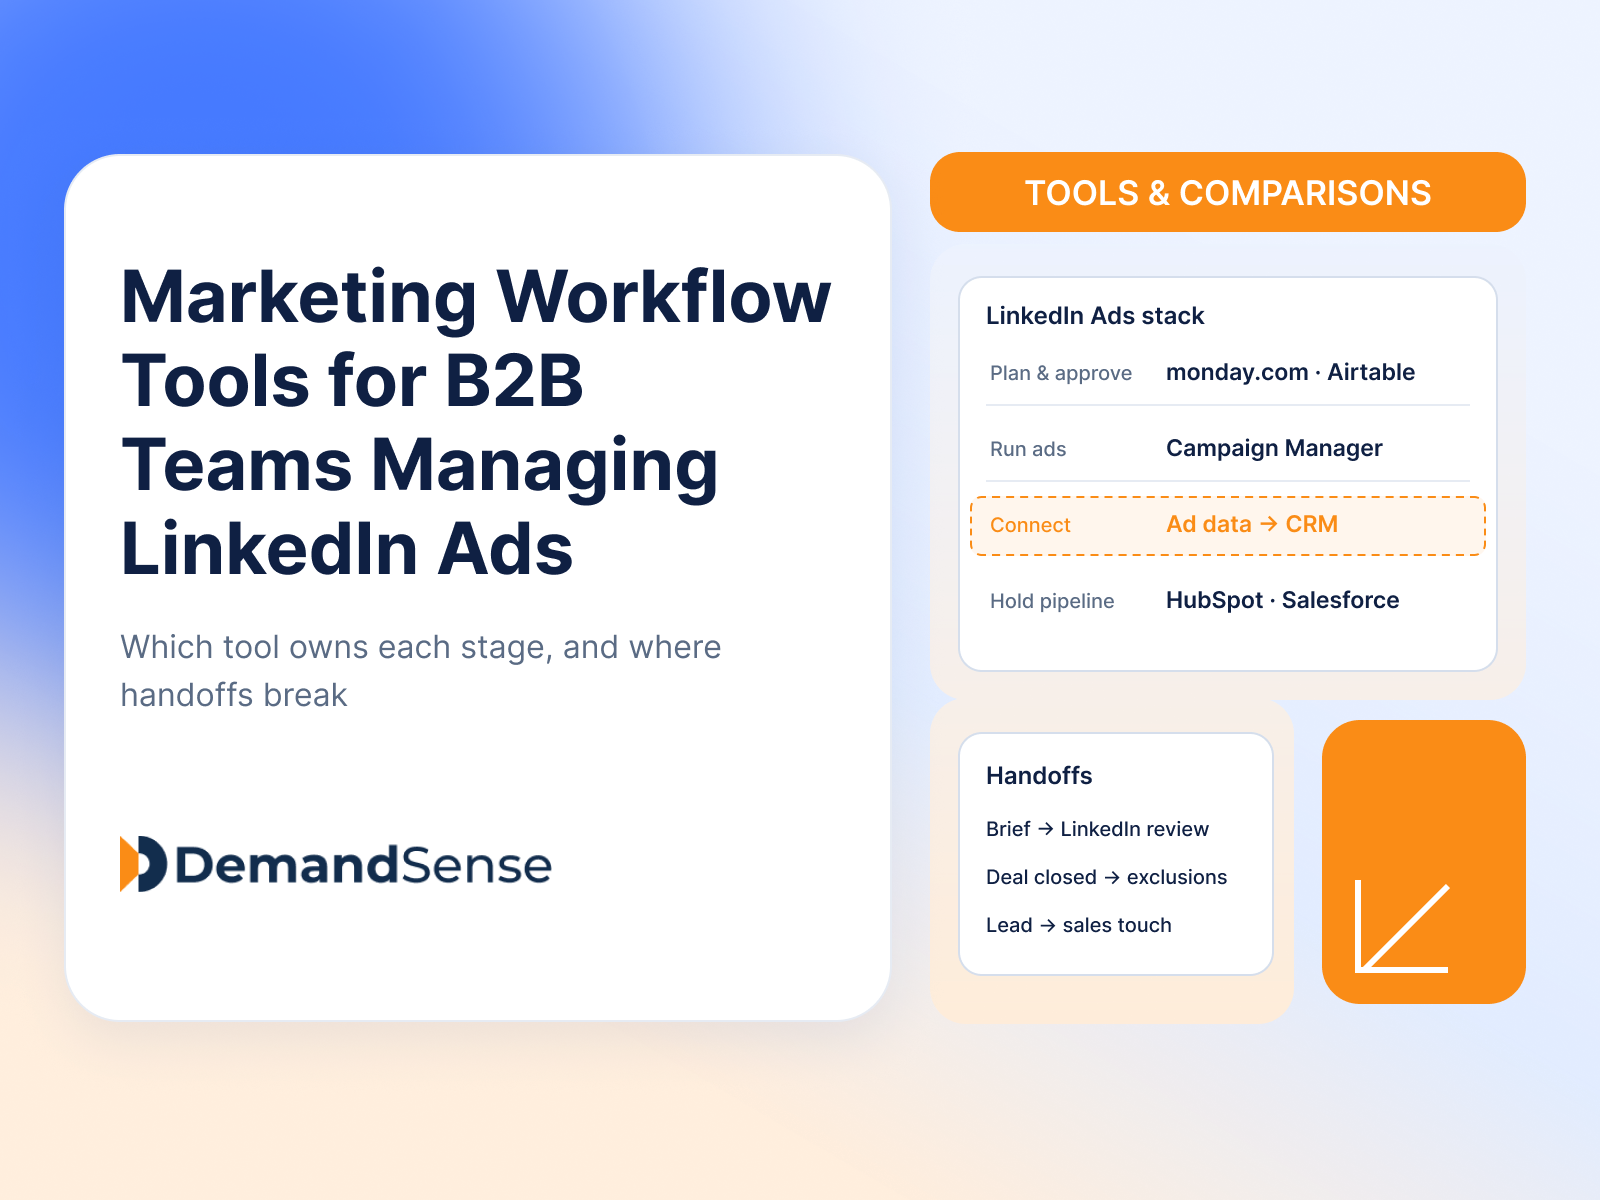
LinkedIn Ads
Tools & Comparisons
The marketing workflow tools B2B teams use to plan, launch, monitor and measure LinkedIn Ads, which stage each one owns, and where the handoffs break.
LinkedIn Ads
Revenue Attribution & Measurement
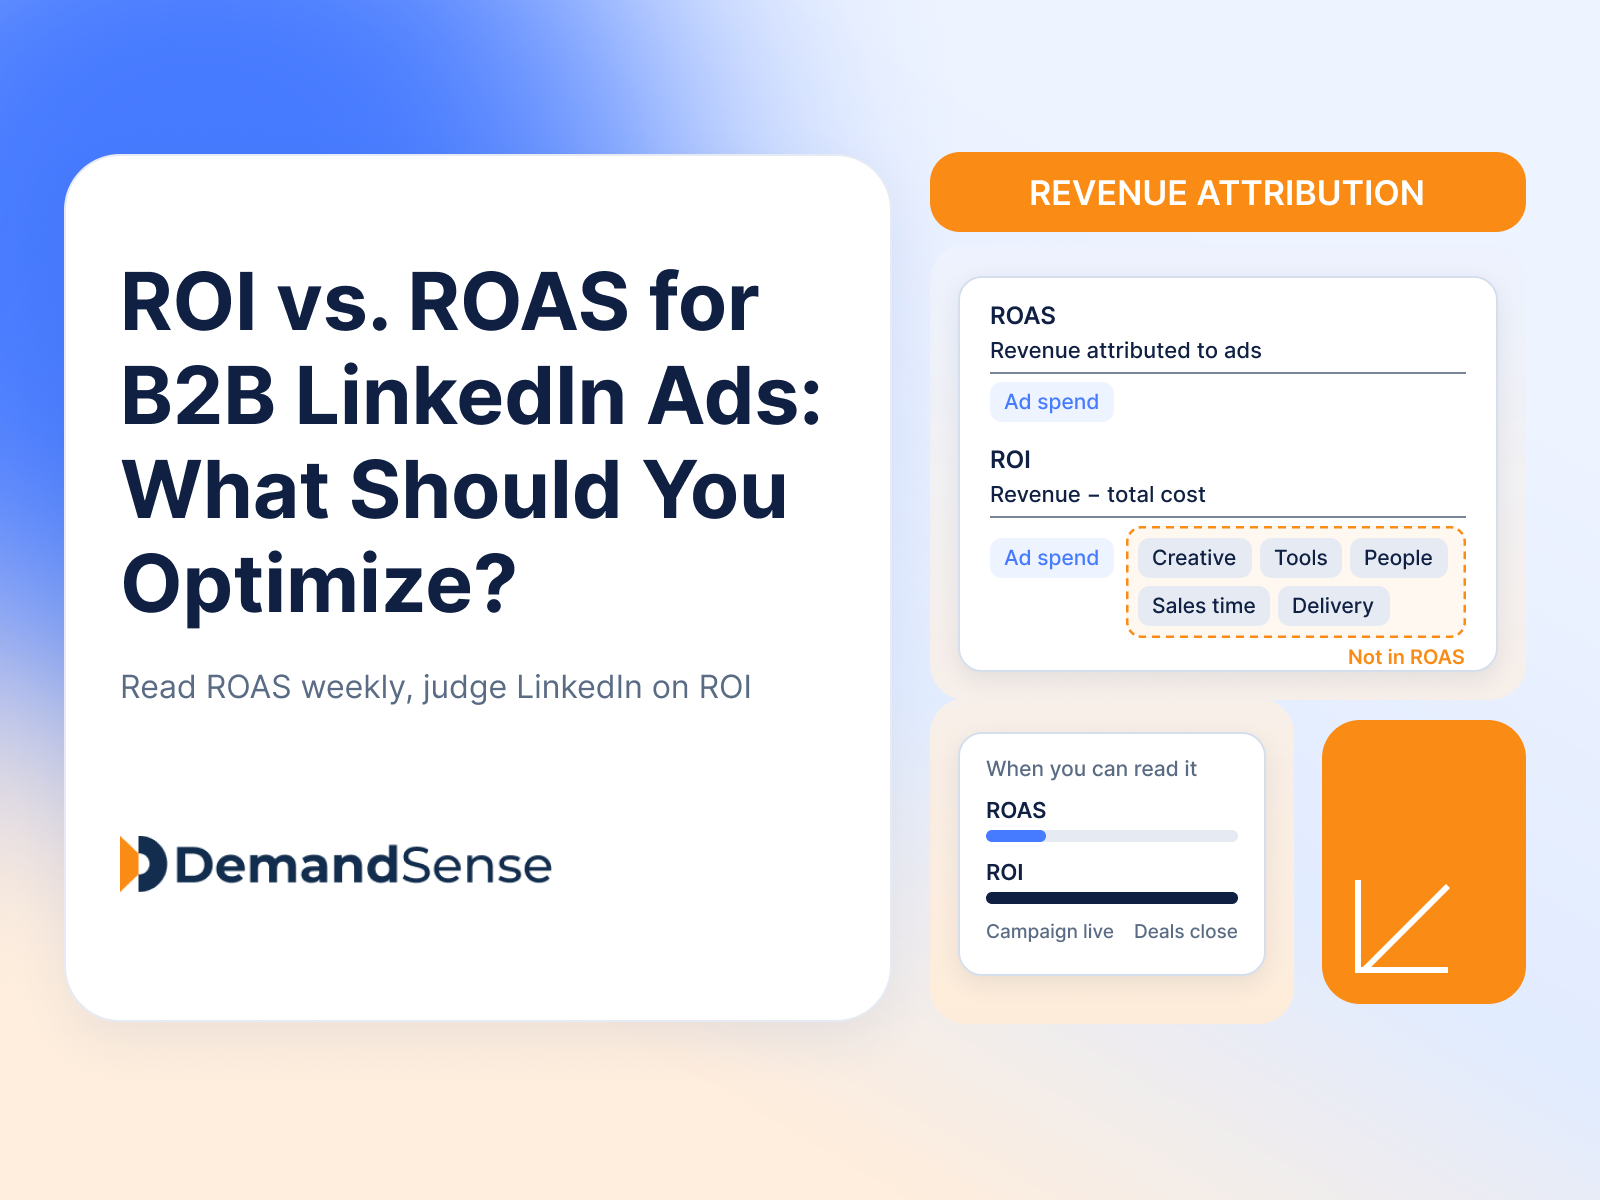
ROI vs. ROAS for B2B LinkedIn Ads: how each is calculated, why a high ROAS can still lose money, and which one to optimize when deals close months later.
LinkedIn Ads
Revenue Attribution & Measurement
What attribution reporting shows B2B teams, which report types to run for LinkedIn campaigns, and how to read the numbers without fooling yourself.
Get expert insights and strategies delivered to your inbox weekly.
