••
Insights & Resources
Expert strategies, case studies, and best practices for B2B marketing teams.
Expert strategies, case studies, and best practices for B2B marketing teams.
Ask Claude anything about your LinkedIn Ads, website visitors and CRM deals. DemandSense MCP
Private early access
LinkedIn Ads
Revenue Attribution & Measurement
A B2B LinkedIn Ads revenue dashboard reports four layers. Spend and delivery covers budget and how campaigns ran. Engagement covers clicks, views and form fills. Account influence covers which companies interacted with the ads before showing up in a deal. Closed revenue covers which of those deals actually closed. Campaign Manager reports the ad, not the deal, so the first two layers exist natively on the platform and the last two have to be assembled from other sources.
LinkedIn Ads reporting is the data Campaign Manager collects on how your campaigns run and perform: impressions, clicks, CTR, spend, cost per result and conversions, all pulled from LinkedIn’s own ad delivery system.
Account-level data shows everything running under the ad account as a whole. Campaign group and campaign levels let you compare strategies or audiences side by side. Ad-level data isolates how a specific creative or format performed. All of it can be filtered by date range, from the last seven days to a custom window, and pulled into a spreadsheet or a connected reporting tool.
That is useful for understanding ad performance, and it stops at the platform’s edge. Campaign Manager reports what happened to the ad: who saw it, who clicked it, who filled out a form. What happened after the form, whether that lead turned into a deal and whether the deal closed, sits in systems Campaign Manager has no view of. Native reporting is campaign-complete and revenue-blind.
Campaign Manager groups its native metrics into five categories.
| Category | Metrics |
|---|---|
| Delivery | Impressions, reach, frequency |
| Cost | Spend, CPC, CPM |
| Engagement | Clicks, CTR, social actions, video views |
| Conversion | Leads, conversion rate, cost per result |
| Demographics | Job function, seniority, company size, industry |
Delivery answers how many people saw the ad and how often. Cost answers what that cost, per click or per thousand impressions. Engagement answers whether people did anything with the ad beyond seeing it. Conversion answers how many of those interactions turned into a lead, and at what price. The demographic breakdowns cut across all four, showing whether the audience matches your target buyer profile by seniority, function, company size or industry, reported in aggregate rather than naming anyone. Our guide to LinkedIn Ads metrics goes through the definitions and how to benchmark each one.
For years, LinkedIn Ads reporting had no concept of revenue at all, only clicks, leads and cost. The Revenue Attribution Report is LinkedIn’s answer to that gap. It works by connecting to your CRM through LinkedIn’s own integration, set up in Business Manager, and matching CRM accounts and opportunities back to the companies that were exposed to your ads. The result is a report inside Campaign Manager showing influenced pipeline tied to LinkedIn ad activity rather than to clicks or form fills. HubSpot, Salesforce Sales Cloud and Microsoft Dynamics are the supported CRMs.
The CRM connection is what makes RAR different from every other native report. Without it, LinkedIn only knows what happened on the platform. Once connected, it can look past its own walls and reference what your sales team is working.
Since 2025, RAR has reported at the company level rather than following individual leads, which matches how B2B buying actually works.
RAR reports influenced accounts, influenced opportunities and LinkedIn-attributed pipeline, along with revenue won, ROAS, win rates, deal sizes and average days to close. All of it is matched and calculated inside Campaign Manager using LinkedIn’s own rules for influence. It doesn’t reference Google Ads, Facebook Ads, email or any channel outside LinkedIn, and there’s no way to export the attribution logic into a model of your own. It is LinkedIn grading its own homework: a useful signal, and one you can’t check against anything outside itself.
Five limits define what native LinkedIn Ads reporting can’t do.
A dashboard that stops at cost per lead can tell you campaigns are cheap to run. It can’t tell you whether LinkedIn is worth the money.
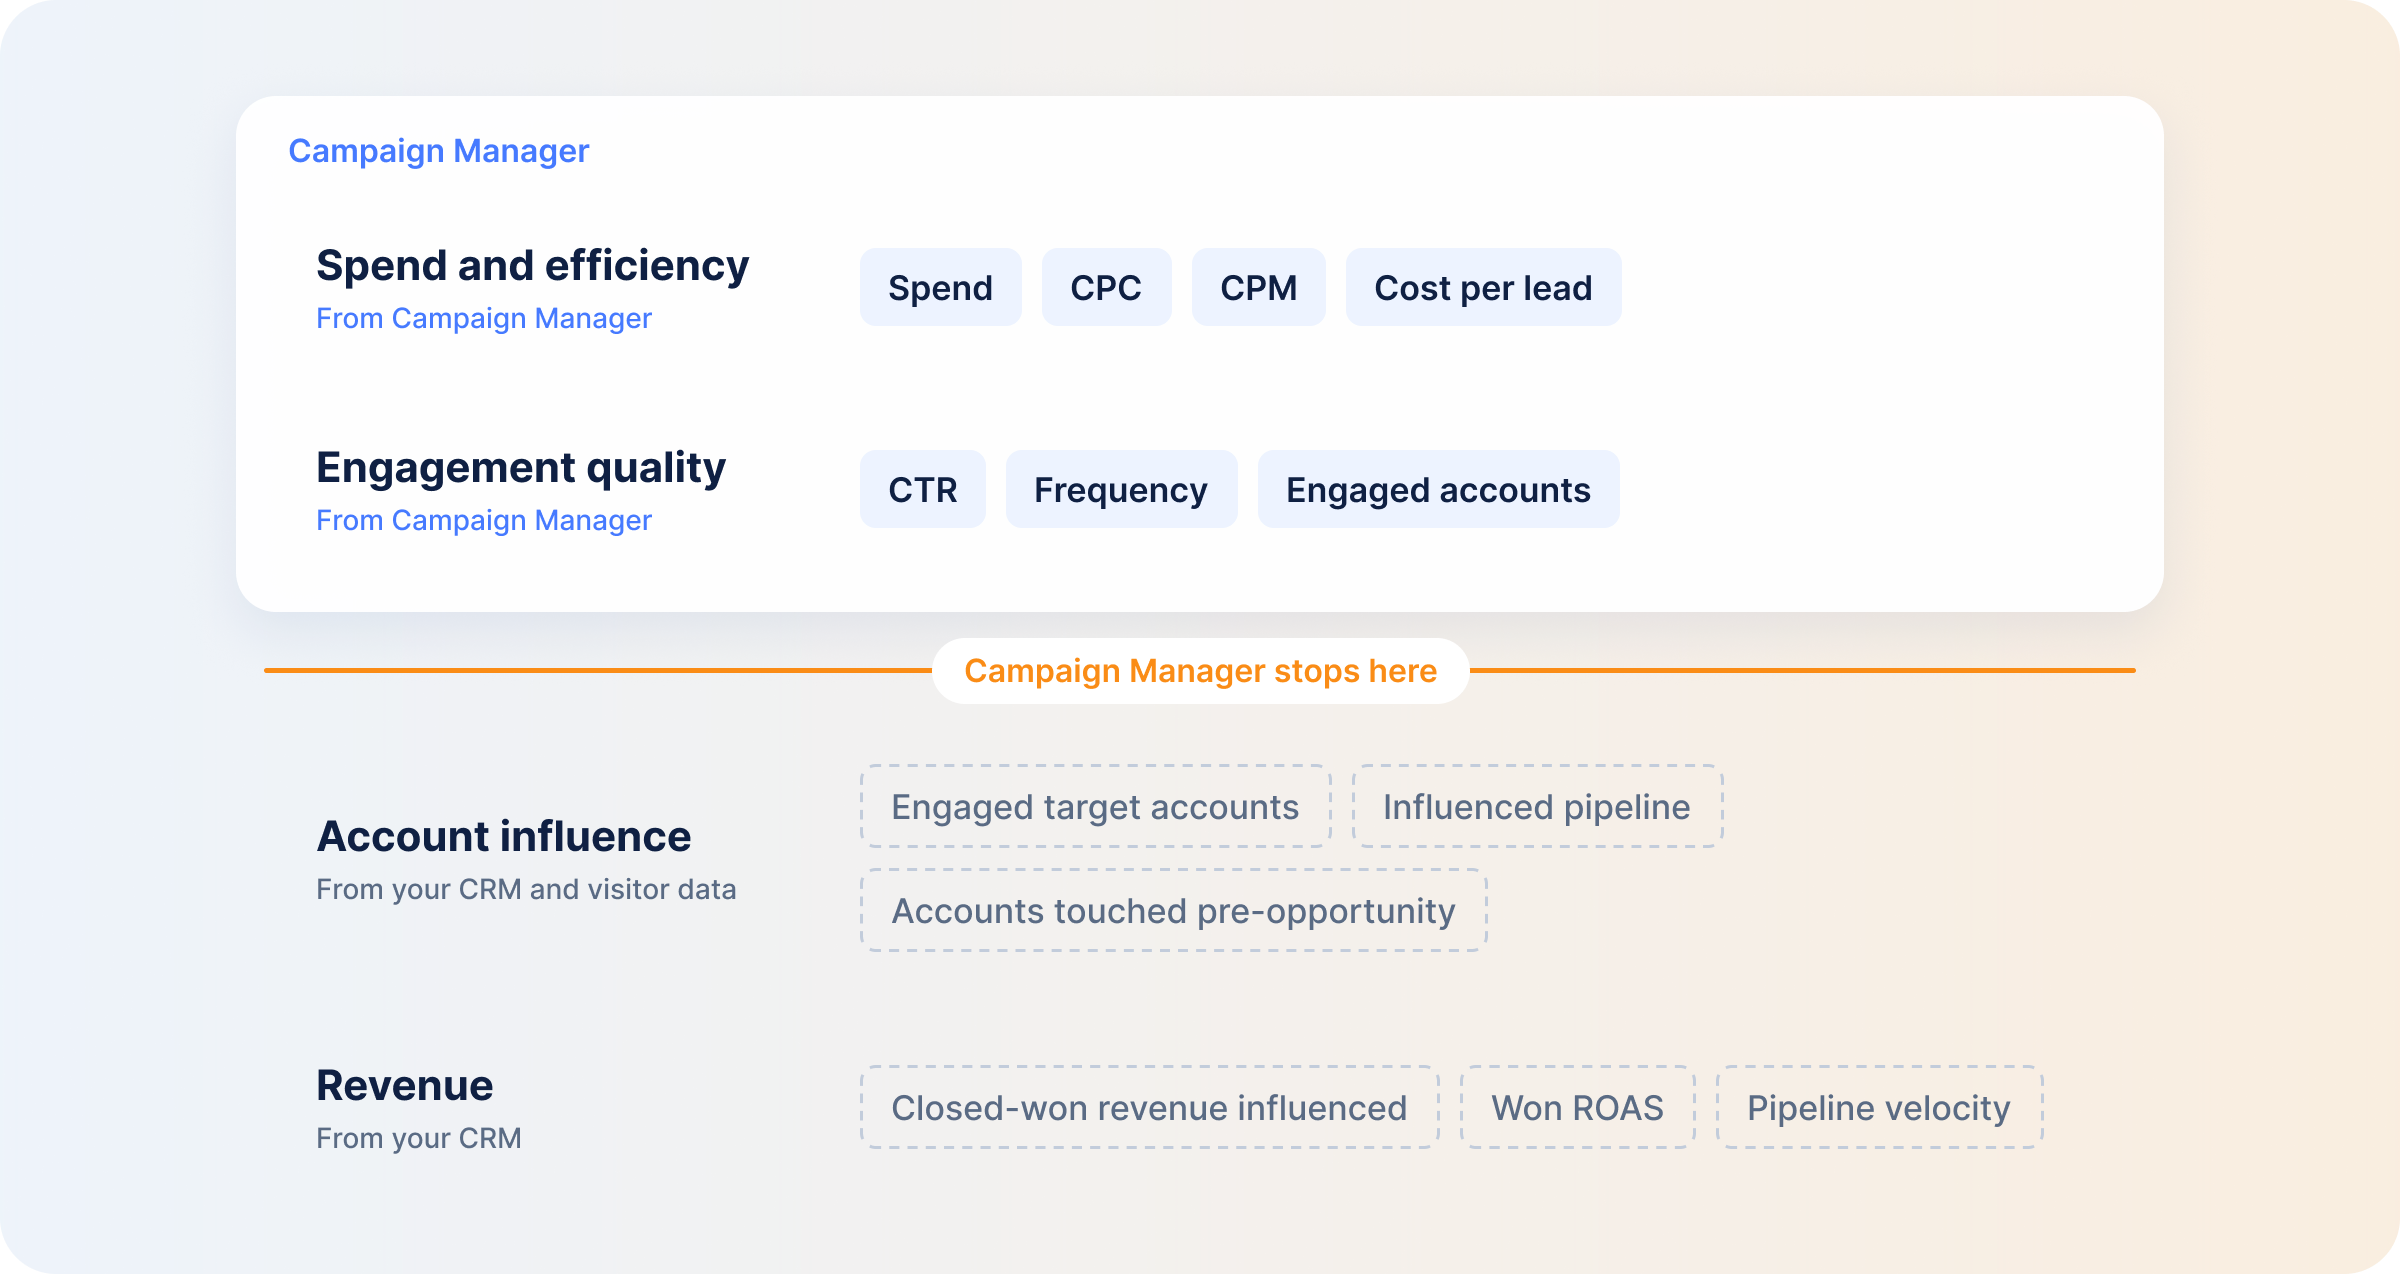
| Tier | Metrics |
|---|---|
| Spend and efficiency | Spend, CPC, CPM, cost per lead |
| Engagement quality | CTR, frequency, engaged accounts |
| Account influence | Engaged target accounts, influenced pipeline, accounts touched pre-opportunity |
| Revenue | Closed-won revenue influenced, Won ROAS, pipeline velocity |
Spend and efficiency metrics are the ones every team already tracks, since they come straight out of Campaign Manager. Engagement quality goes a layer deeper, checking whether the accounts engaging are ones worth engaging, and whether the rate itself is any good: LinkedIn CTR sits around 0.52% against 0.875% for top performers in our 2025 B2B Benchmark Report. Account influence is where the dashboard starts answering B2B-shaped questions, tracking target accounts and whether they were touched before an opportunity opened. Revenue settles the ROI question, pairing closed-won revenue and Won ROAS with pipeline velocity so you see how fast deals moved as well as whether they landed.
RAR connects your CRM to LinkedIn ad exposure and reports influenced pipeline inside Campaign Manager. It sees accounts and opportunities LinkedIn can match against ads it served, using its own definition of influence. What it misses is everything outside LinkedIn: no Google Ads, no email, no organic. It accounts for LinkedIn’s slice of a buying journey that usually touches several channels, which makes it a first-party signal rather than a full picture.
Click reporting only sees who clicked. Impression attribution sees who was exposed, aggregated up to the account rather than the individual, which matters because B2B deals move through several people at one company before anyone clicks. What it can’t do is prove causation on its own, since exposure isn’t influence. Our guide to connecting impressions to pipeline covers the mechanics.
UTM parameters tie a click to a specific campaign, ad and landing page, and they are the most granular method available while the chain holds. It breaks in several predictable places: dark social shares that strip parameters, someone clicking on mobile and converting later on desktop, and lead forms that don’t pass UTM data into the CRM at all. There is no flag when this happens. The data simply isn’t there when you go looking for it.
Asking “how did you hear about us” inside the CRM adds a human answer to a set of otherwise automated models. Buyers sometimes surface a channel none of the tracked methods caught, which is genuinely useful. The answers are also shaped by what a buyer happens to remember rather than by what actually influenced them, so this belongs alongside RAR, impression and UTM data as a cross-check rather than on its own.
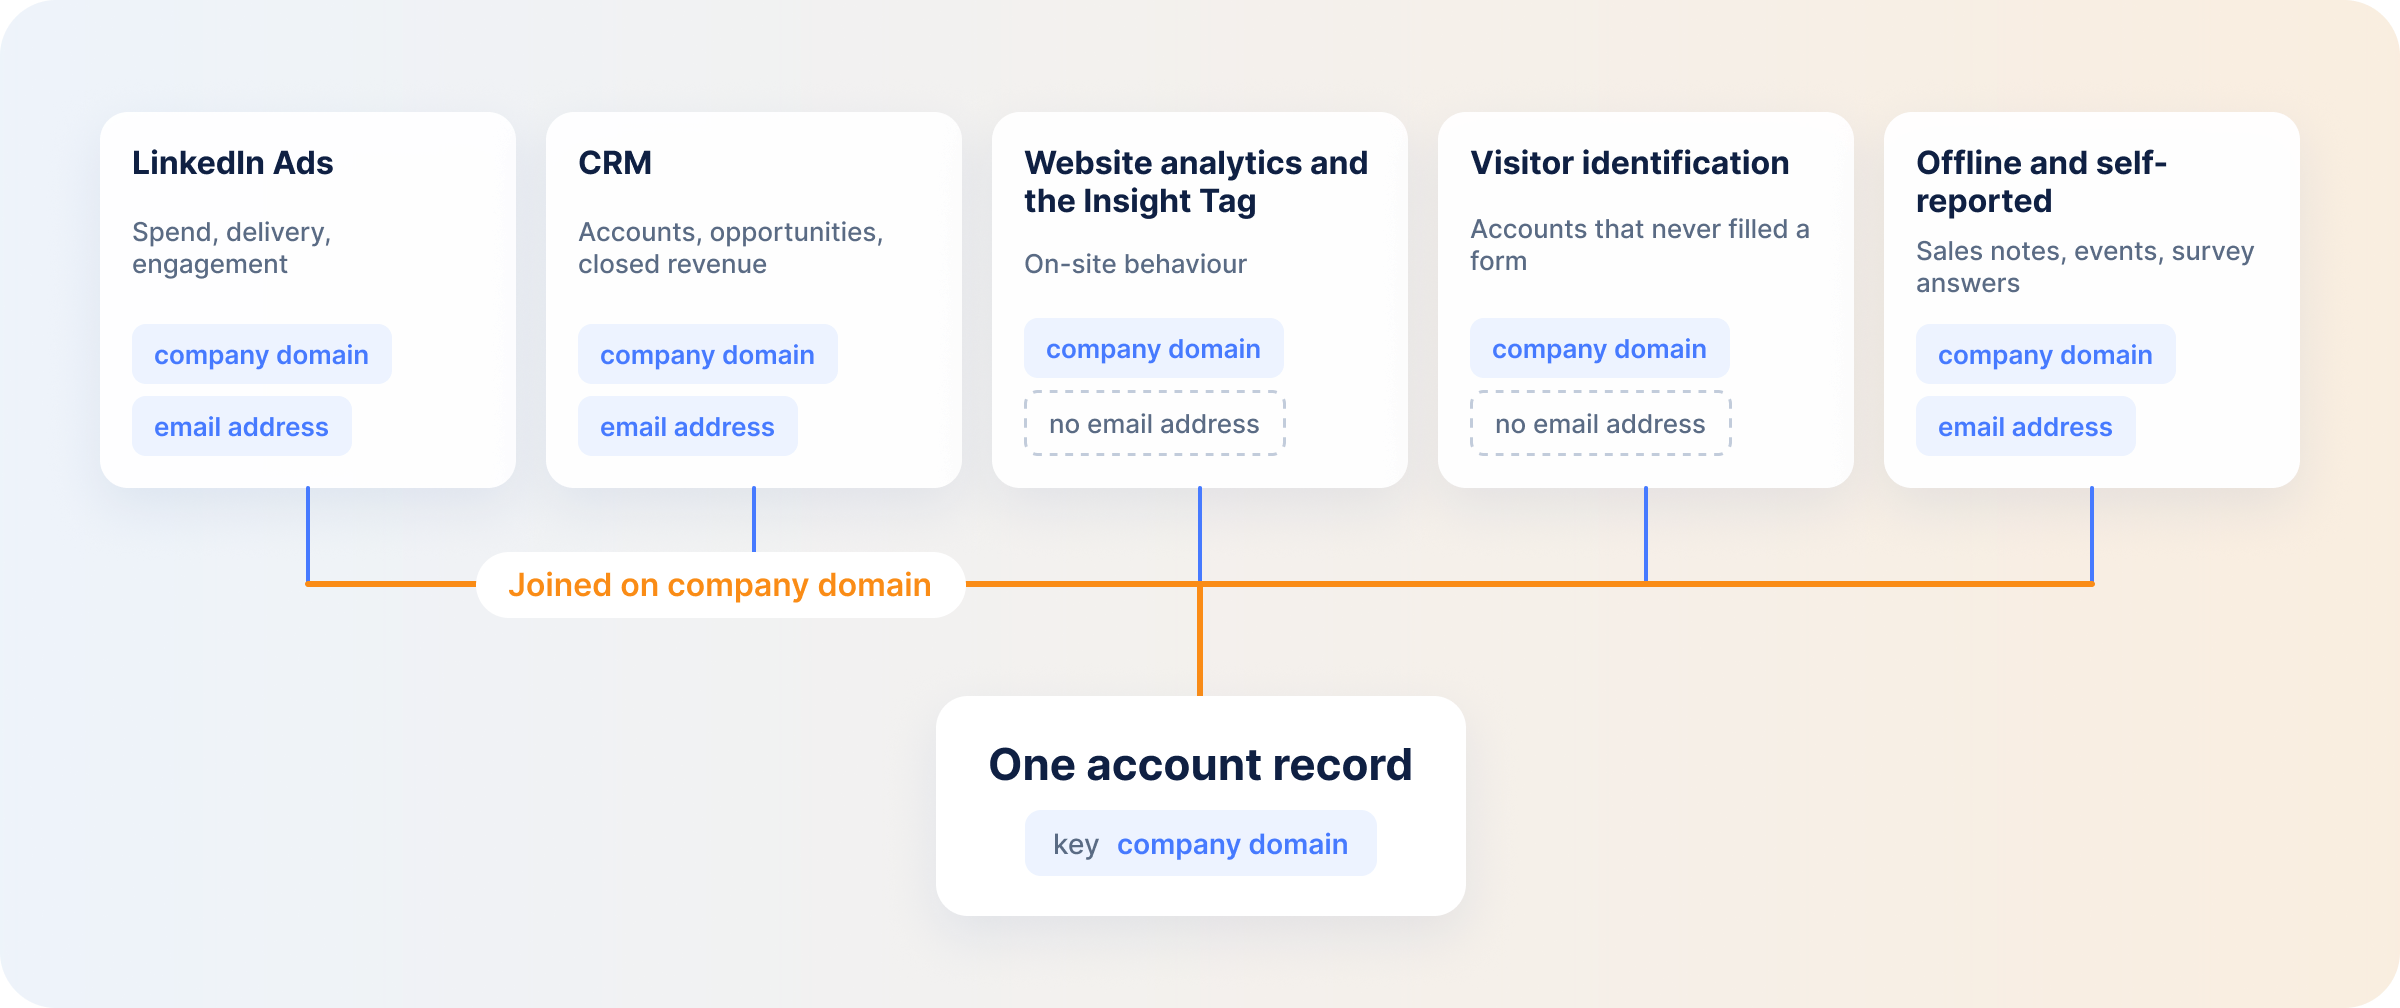
A revenue dashboard pulls from five sources, each covering a piece the others can’t.
Every source above has to join on the same key to be useful together, and that key is company or domain, not email. Email addresses change, get typed wrong, or never get captured at all, which is especially true of anonymous visitors. Company and domain persist across every person at that account, which is how B2B buying actually happens.
There are three practical ways to automate this reporting, each trading control for setup effort.
Everything covered so far exists as separate views: ad performance in Campaign Manager, account activity in a CRM, revenue somewhere else again. DemandSense puts the three together, so ad activity, account engagement and closed revenue sit on one screen instead of three tabs you reconcile by hand. LinkedIn is where it starts; Google Ads, Facebook Ads and StackAdapt connect too, and their engagement feeds the same picture.
The familiar layer: spend, CPC, CPM and engagement broken out by campaign, sitting next to account and revenue data rather than isolated in Campaign Manager. You confirm delivery and cost here before asking what that spend produced further down the funnel.
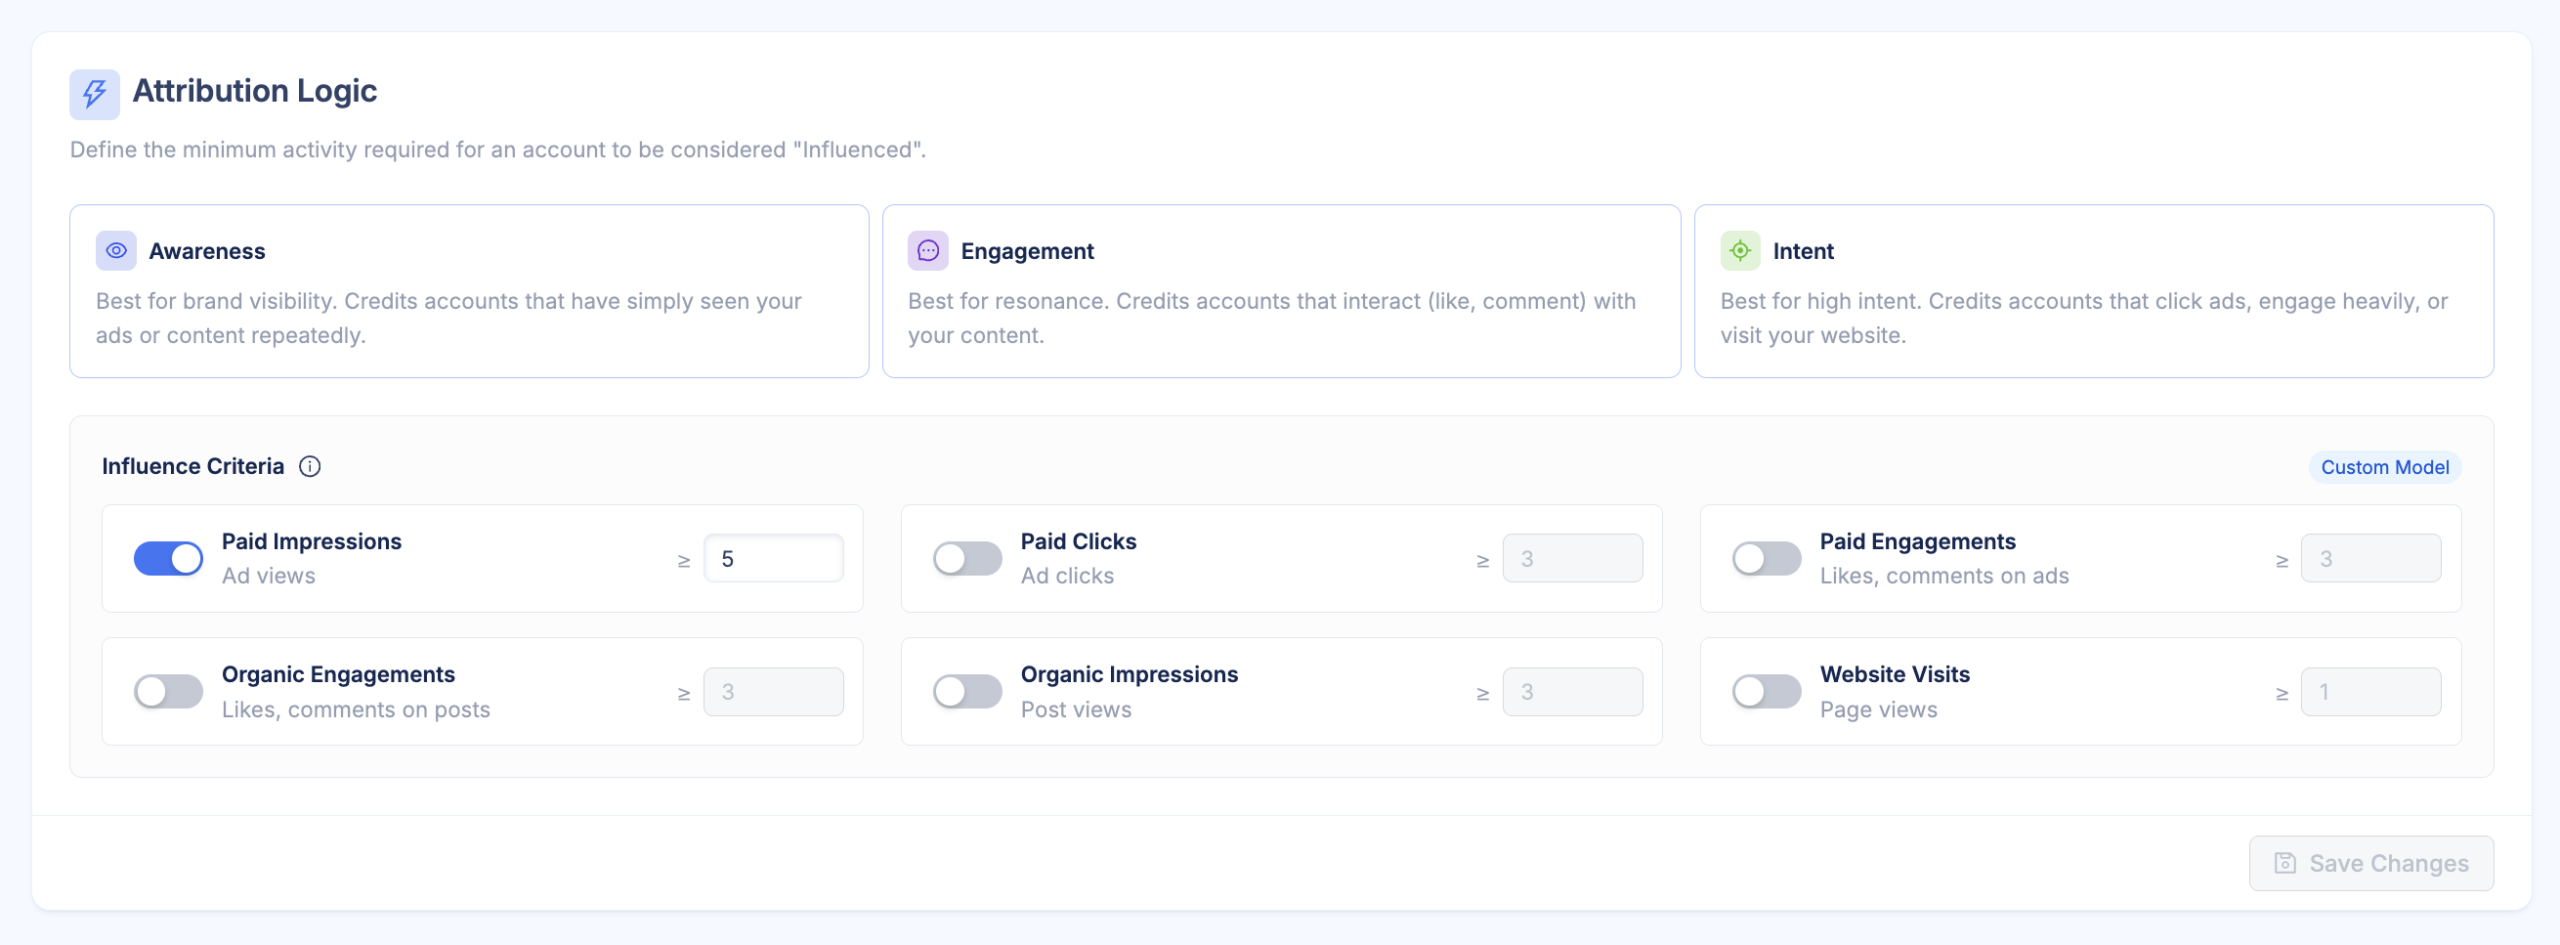
This report tracks which target accounts engaged with your LinkedIn ads and which of those accounts appear in open pipeline. Three presets, Awareness, Engagement and Intent, define what counts as influence, or you can set your own thresholds across paid, organic and website signals. The lookback window is 3, 6 or 12 months. It answers whether ad-engaged accounts are moving, which our breakdown of LinkedIn pipeline attribution covers in depth.
This report ties closed-won revenue back to specific campaigns and reports Won ROAS alongside it, revenue on won deals against the spend that reached them. It answers whether the spend paid off.
Seeing it on your own data takes a 30-day trial, and there’s no card to enter at demandsense.com.
It depends on the job. Native reporting covers delivery and spend. A BI tool suits bespoke, fully custom builds. For connecting ad activity to actual revenue, an attribution platform like DemandSense is built to join LinkedIn data with CRM outcomes.
Review spend and delivery weekly, pipeline monthly and revenue quarterly. B2B outcomes lag clicks by weeks or months, so checking revenue on a weekly cadence measures noise rather than real performance change.
Judging campaigns by CTR alone, changing the lookback window mid-quarter, mixing person-level and account-level numbers in the same chart, and reporting leads sales never worked as if they were qualified pipeline.
Yes. The objective you select determines which columns populate and what your budget is optimizing for. A lead gen campaign reports differently than an awareness campaign, since each is buying a different outcome.
Badly, for B2B. Last-click credits the final touch before conversion, which is usually branded search or a direct visit, and LinkedIn’s influence typically lands earlier in the journey and disappears from the report. Our LinkedIn attribution model explainer covers why.
Shift budget based on influenced pipeline and won revenue rather than cost per lead alone, and consider trimming spend aimed at accounts that already closed through another channel. Our guide to LinkedIn Ads budget for B2B campaigns covers the full framework.
Get expert insights and strategies delivered to your inbox weekly.
Book a personalized demo and discover how we can transform your B2B marketing.
See a quick demo video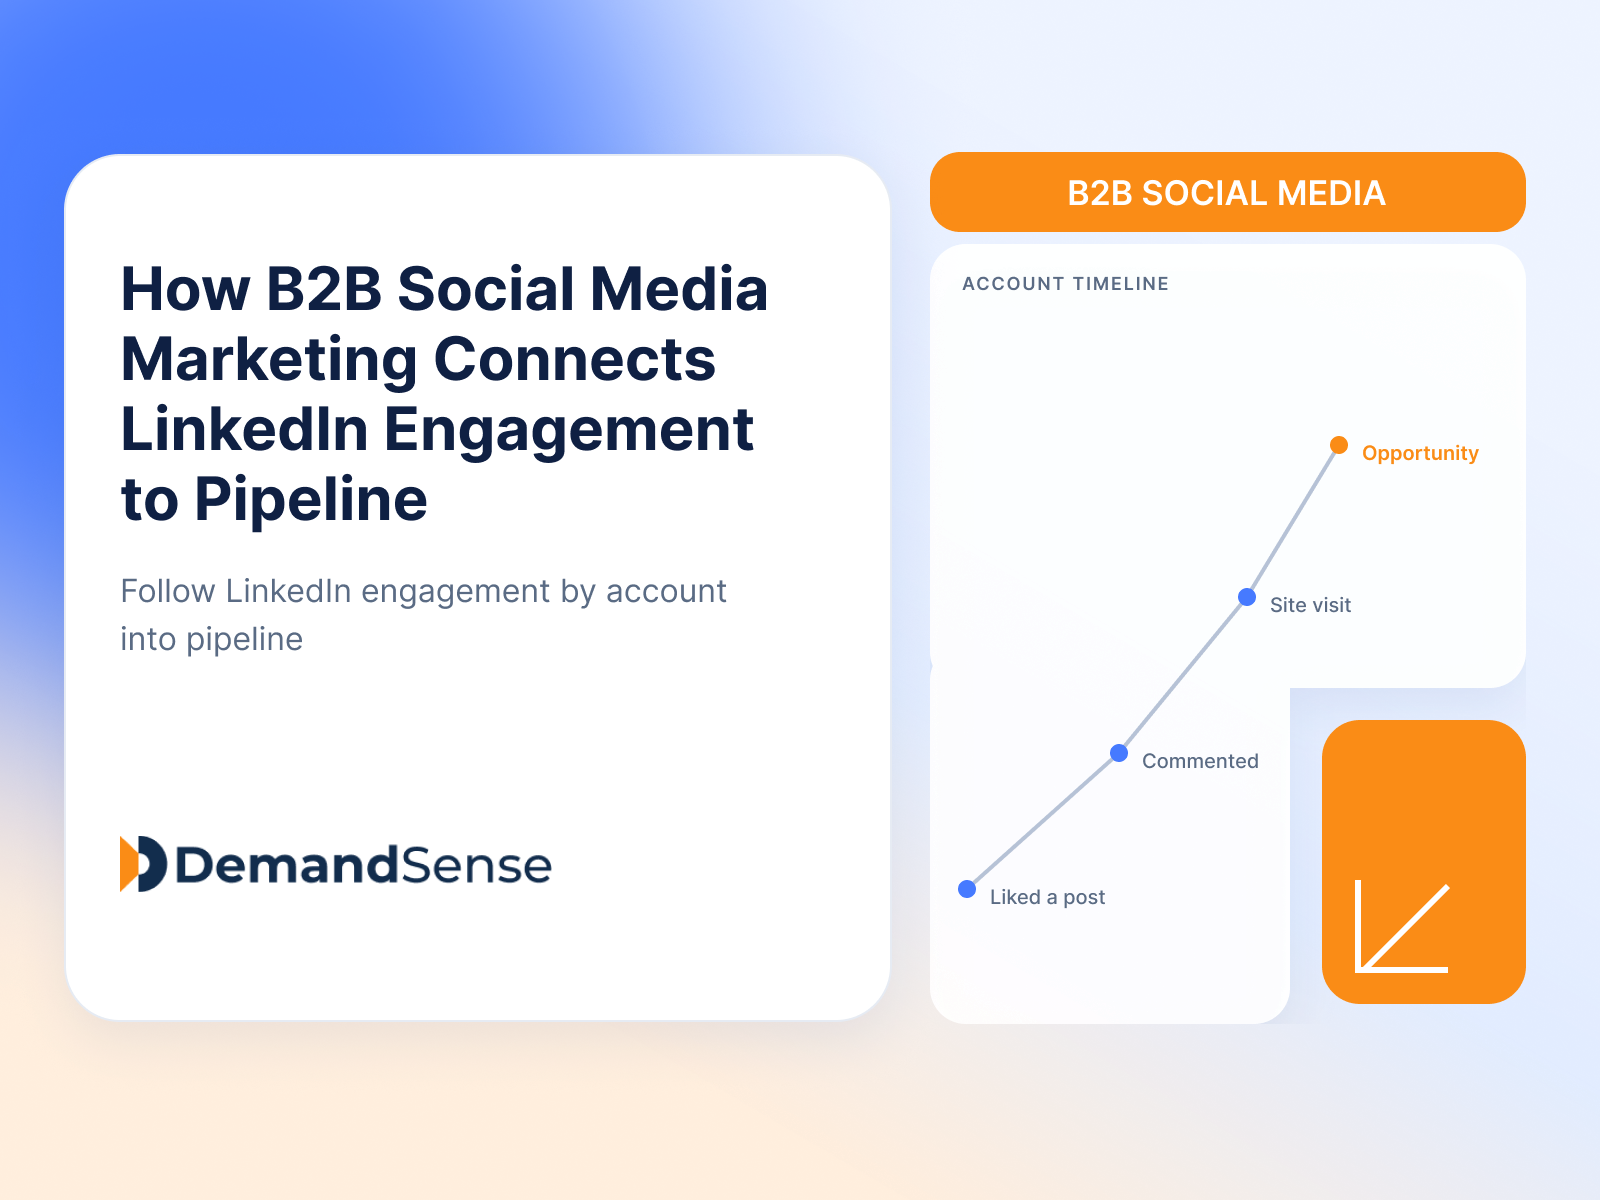
LinkedIn Ads
Revenue Attribution & Measurement
How B2B social media marketing works on LinkedIn: which platforms earn a place, what to post, and how to turn engagement into measurable pipeline.
LinkedIn Ads
Revenue Attribution & Measurement
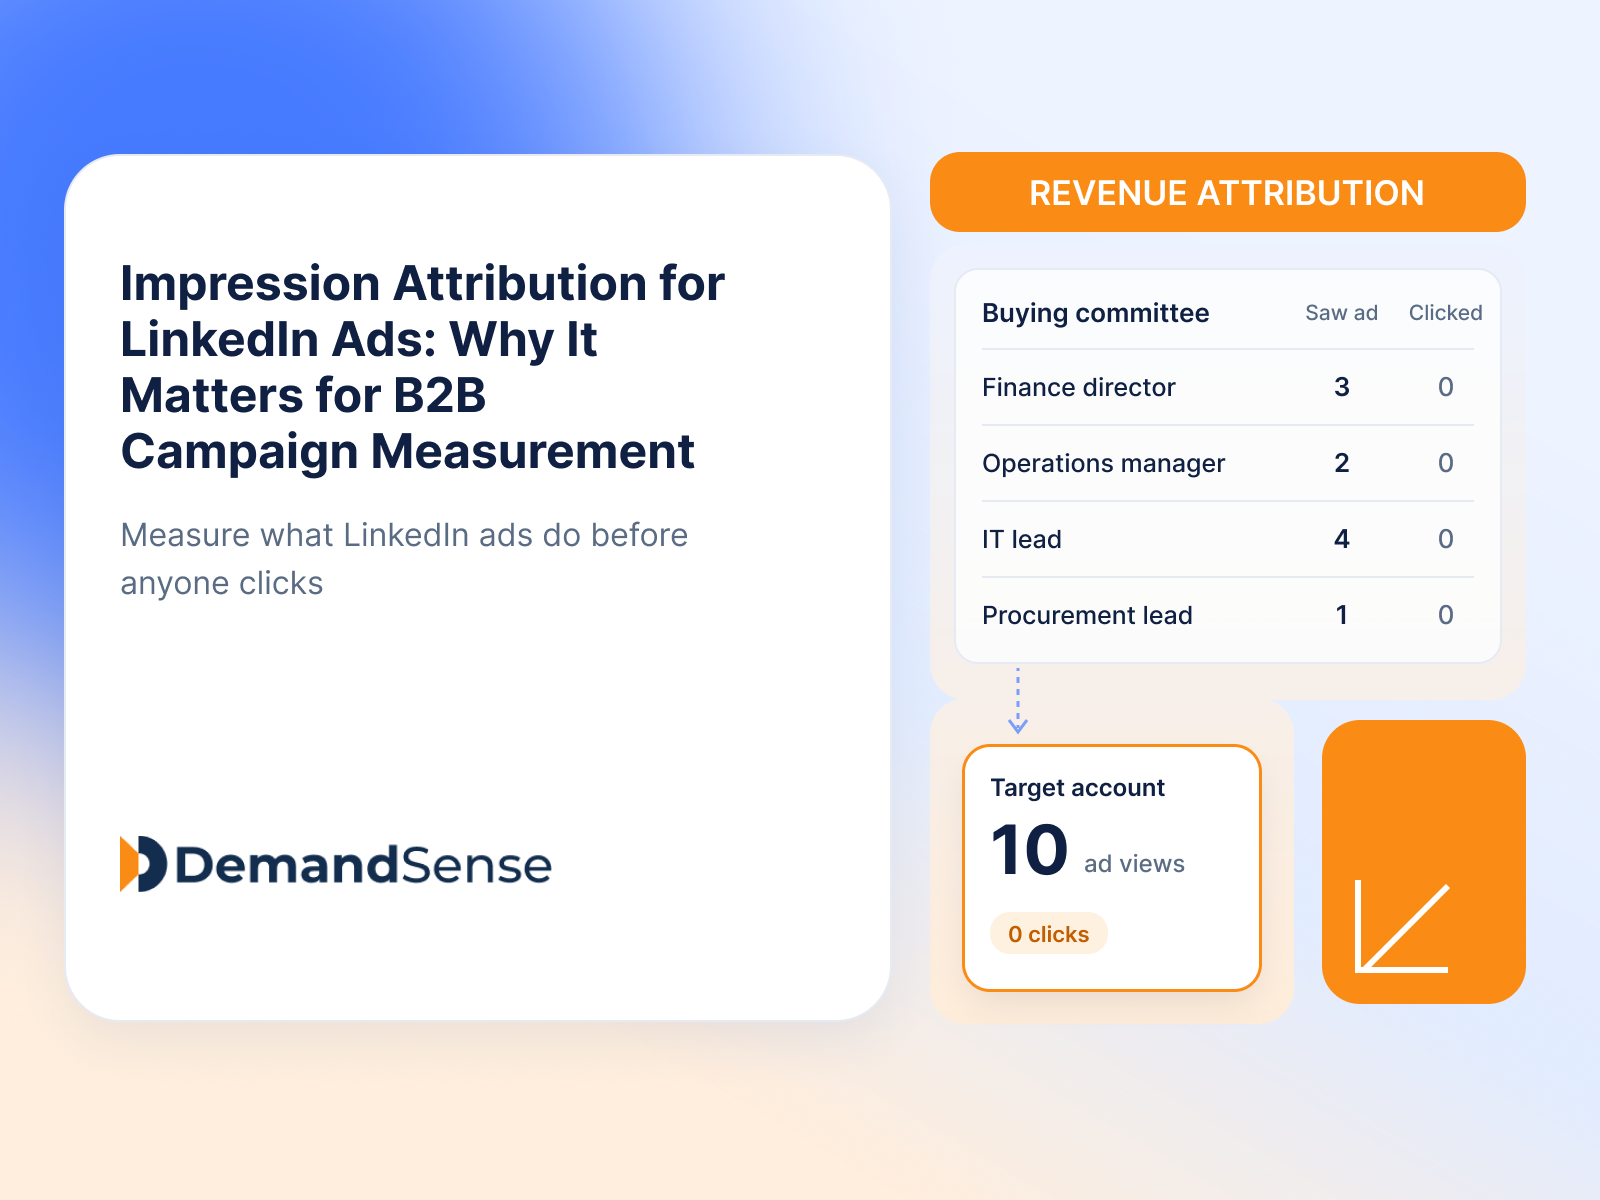
How LinkedIn impression attribution works, how it differs from click and view-through attribution, and what it reveals about B2B campaign performance.
LinkedIn Ads
Revenue Attribution & Measurement
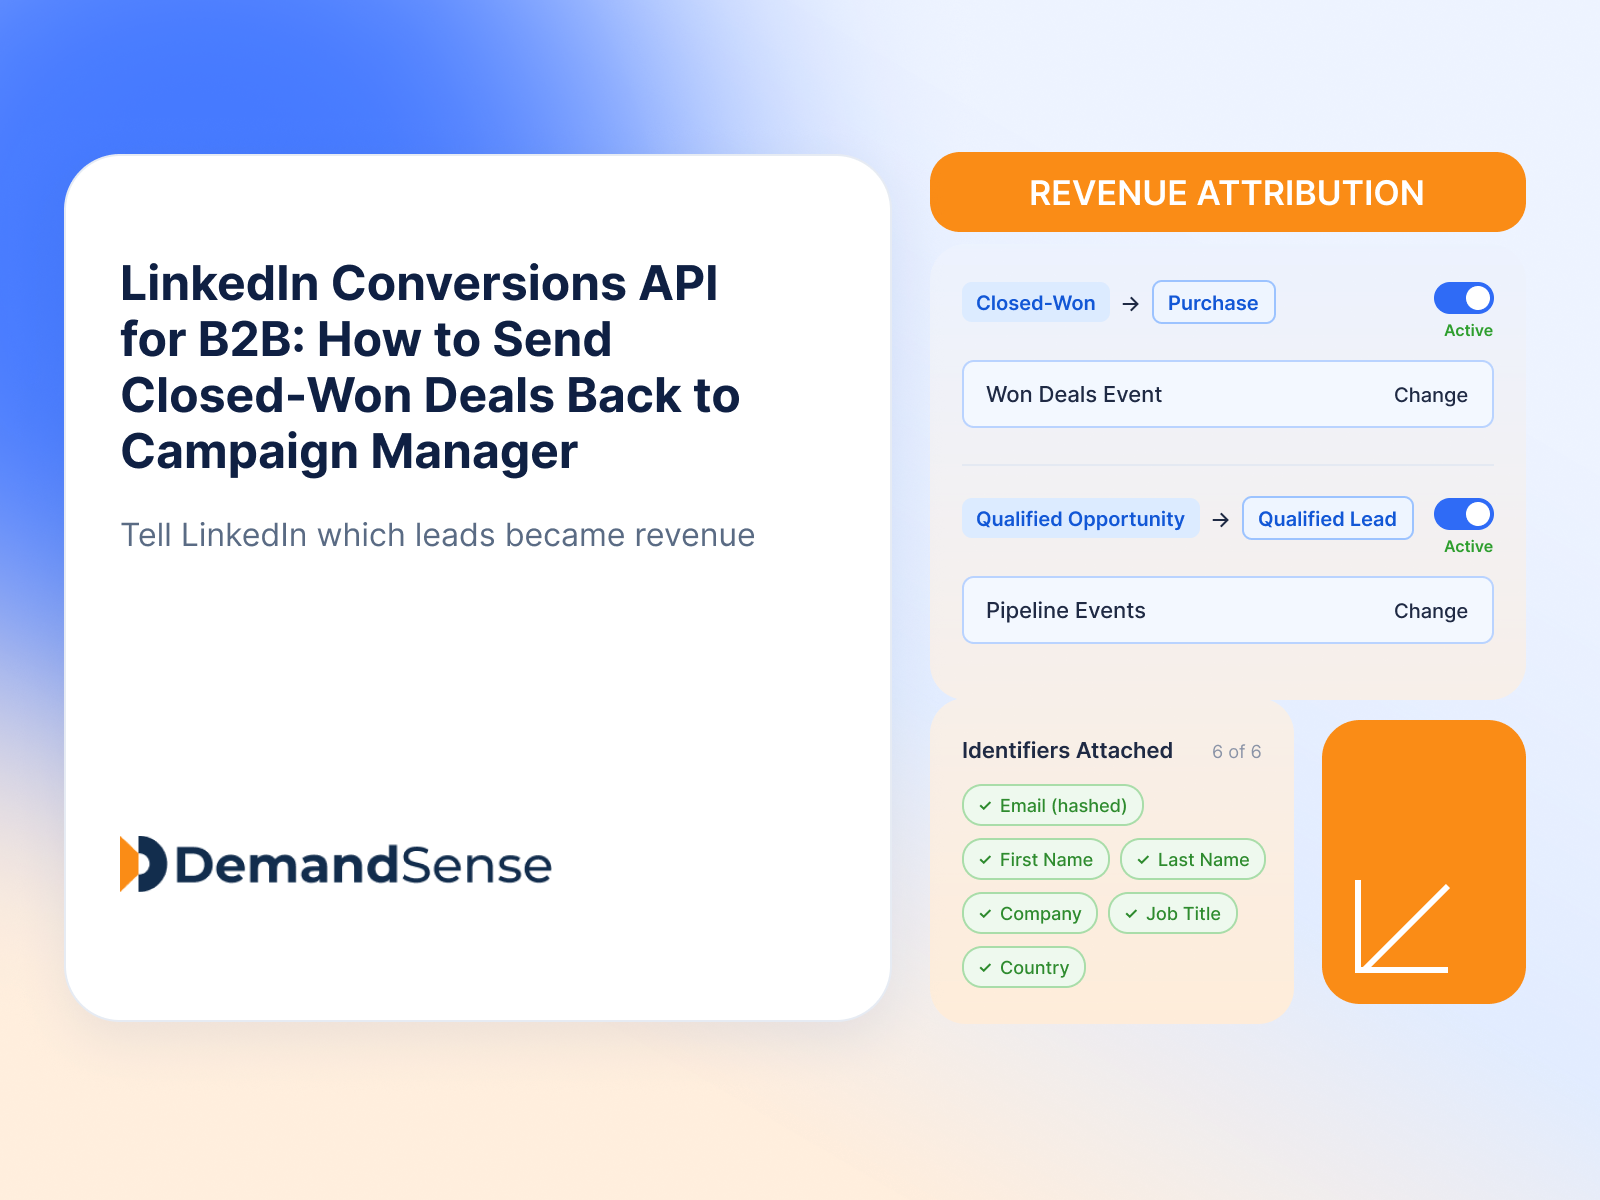
How the LinkedIn Conversions API works, what to send, how it fits with the Insight Tag, and how B2B teams get closed-won deals into Campaign Manager.