LinkedIn Ads
MQL vs. SQL for B2B LinkedIn Ads and Why Lead Quality Matters
What an MQL and an SQL are, how to qualify leads from LinkedIn Ads, and why lead quality, not lead volume, decides whether campaigns build pipeline.
How to build a B2B account scoring model from LinkedIn engagement signals: which signals to use, how to weight fit and engagement, and how to test it.
Not every account you target on LinkedIn is ready to buy. If you don’t know which accounts to reach first, sales and marketing efforts get spread across companies that won’t buy any time soon. Building a B2B account scoring model helps solve this problem. This guide covers what goes into the model, how to build it from LinkedIn engagement data, and how to check it against your pipeline.
B2B account scoring is a way to rank and assign value to companies, not individual leads, by how well they fit and how actively they engage, so marketing and sales work the same short list first.
LinkedIn already reports engagement per company, so it fits account scoring better than lead scoring.
An account’s value is determined by three inputs:
These three inputs combined put each account in a tier, from high to mid to low priority.
Both account and lead scoring help you prioritize for marketing and sales, but they differ in the following ways:
| Scoring Level | Data Used | Buying Signal | Best Use | Main Limitation |
|---|---|---|---|---|
| Lead scoring | One person’s actions plus their job title and role | A hot lead ready for sales follow-up | Lead generation campaigns aimed at individual buyers | Mistakes research, like a white paper download, for buying readiness |
| Account scoring | Fit, engagement and intent of the company as a whole | A high-value account sales and marketing should focus on | ABM campaigns with long, complex B2B sales cycles | The totals hide what each stakeholder needs |
Lead scoring reads one person’s actions; account scoring reads several people across roles at the same company, which is closer to how B2B purchases are decided. Most teams use both, with the account score deciding which leads get worked first.
Your total addressable market might be large, but not every account deserves the same attention. With a good account scoring model:
If your Tier A accounts don’t turn into opportunities sales can close, your scoring criteria need adjusting.
A B2B account scoring model combines three kinds of signal: fit, engagement and intent. Each one answers a different question.
Does the company belong in your market?
Your ideal customer profile is the most basic form of account-based intelligence: it tells you whether an account is worth targeting at all. An account is a good fit if it matches your ICP attributes:
You should also use negative scoring to mark poor-fit accounts and exclude them from campaigns: competitors, existing customers, agencies and companies that are too small.
Fit is mostly static, so it’s the base of the score. But an account can fit perfectly and still not be a priority right now.
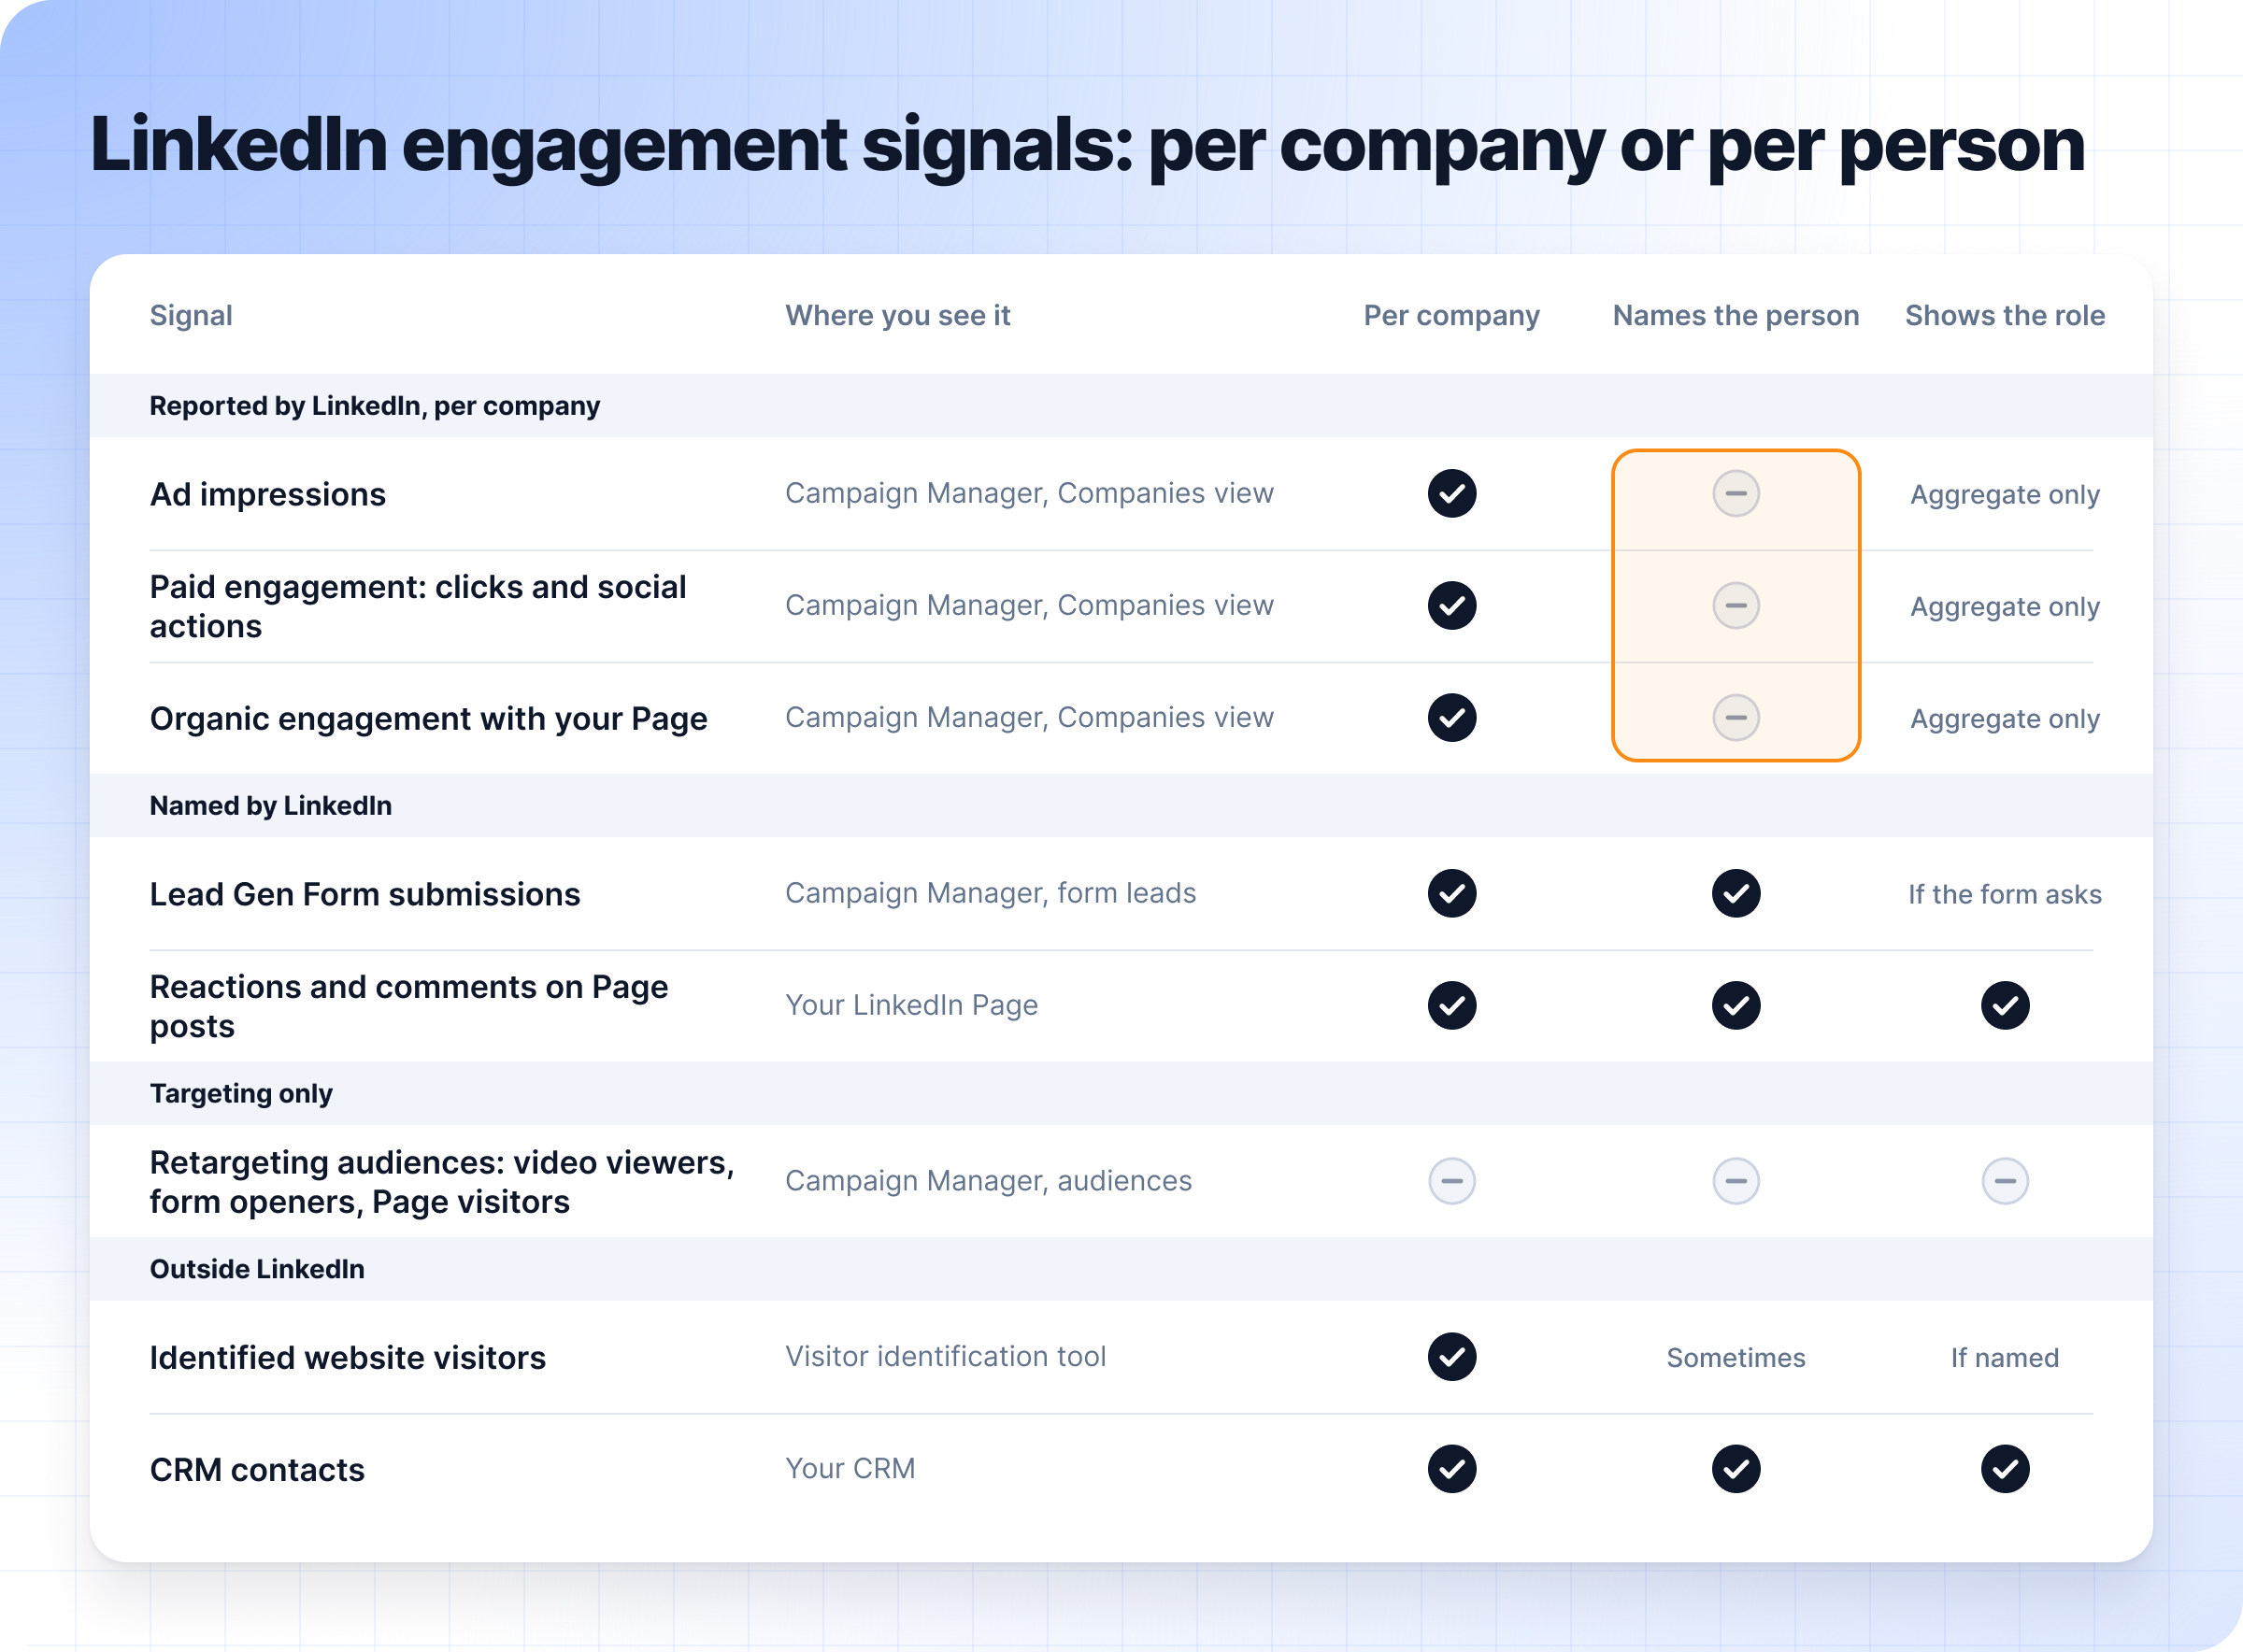
Is the company responding to you? The engagement signals LinkedIn gives you are:
The Companies view rolls up the first two per company. Paid engagement is reported per company, not per person, so LinkedIn doesn’t tell you which members saw or clicked an ad. Demographics reporting shows the job functions, seniorities and companies engaging with a campaign, but only in aggregate. It doesn’t break roles out per account, and it says nothing about fit or intent.
Is the company researching the problem? You can tell by looking at signals like:
Engagement shows the account responding to you; intent shows it researching the problem. You can read more about where these signals come from in this guide to B2B intent data.
A click on your Company Page shows curiosity, but it doesn’t mean the account is ready for sales. These four things tell you more:
Here’s a step-by-step guide you can use for your scoring process.
Start from closed-won deals, especially the accounts that closed fastest, stayed longest and spent the most. Their shared traits are the attributes to score.
Weight each attribute by how well it separates your best customers from poor-fit accounts. For a data security SaaS company, the ICP rule might be: a North American B2B FinTech company running on AWS with Snowflake that recently hired a new VP of Data. As an example fit score out of 50 points:
| Attribute | Max Points | Scoring Rule (example) |
|---|---|---|
| Industry vertical | 15 | B2B FinTech or InsurTech = 15; general B2B SaaS = 5; manufacturing or agency = 0 |
| Company size | 15 | 50–200 employees = 15; 200–500 = 8; over 500 or under 50 = 0 |
| Tech stack fit | 15 | AWS with Snowflake = 15; Azure or Google Cloud = 8 |
| Trigger | 5 | Recently hired a new VP of Data = 5; no recent change = 0 |
| Total fit | 50 | Half of the 100-point account score in step 4 |
Add negative scoring for competitors, existing customers and poor-fit segments. If the ICP itself is still open, start by learning how to find your target audience on LinkedIn.
Pick four to six signals, not twenty, then weight them by how close each sits to a deal: a Lead Gen Form submission counts for more than an impression. Here’s an example table you can adapt:
| Signal | Points (example) | Why |
|---|---|---|
| Lead Gen Form submission | 15 | Someone at the account traded their details for the offer |
| Website visit from an ad | 8 | The account went from the ad to researching your brand |
| Ad click | 5 | Some people click out of curiosity |
| Ad impressions | 2 | Shows exposure, not engagement |
In the worked example below, engagement is capped at 30 points, however many signals an account piles up.
Keep in mind that native Lead Gen Forms are prefilled from a member’s LinkedIn profile, which makes it easy for the wrong people to submit them too. Depending on the offer, you can score a form completed on your website higher than a native one.
Roll everything up to the company. LinkedIn’s Companies view gives you paid and organic engagement per account, which is a good starting point. Then count distinct roles engaged, not just total actions, and cap the points one person can add. Named contacts from forms, your CRM and identified site visitors show that breadth.
This is where account-based marketing attribution comes in: it reads each target account’s ad engagement next to its site visits and CRM deals, so you can see which engaged accounts turned into pipeline and revenue.
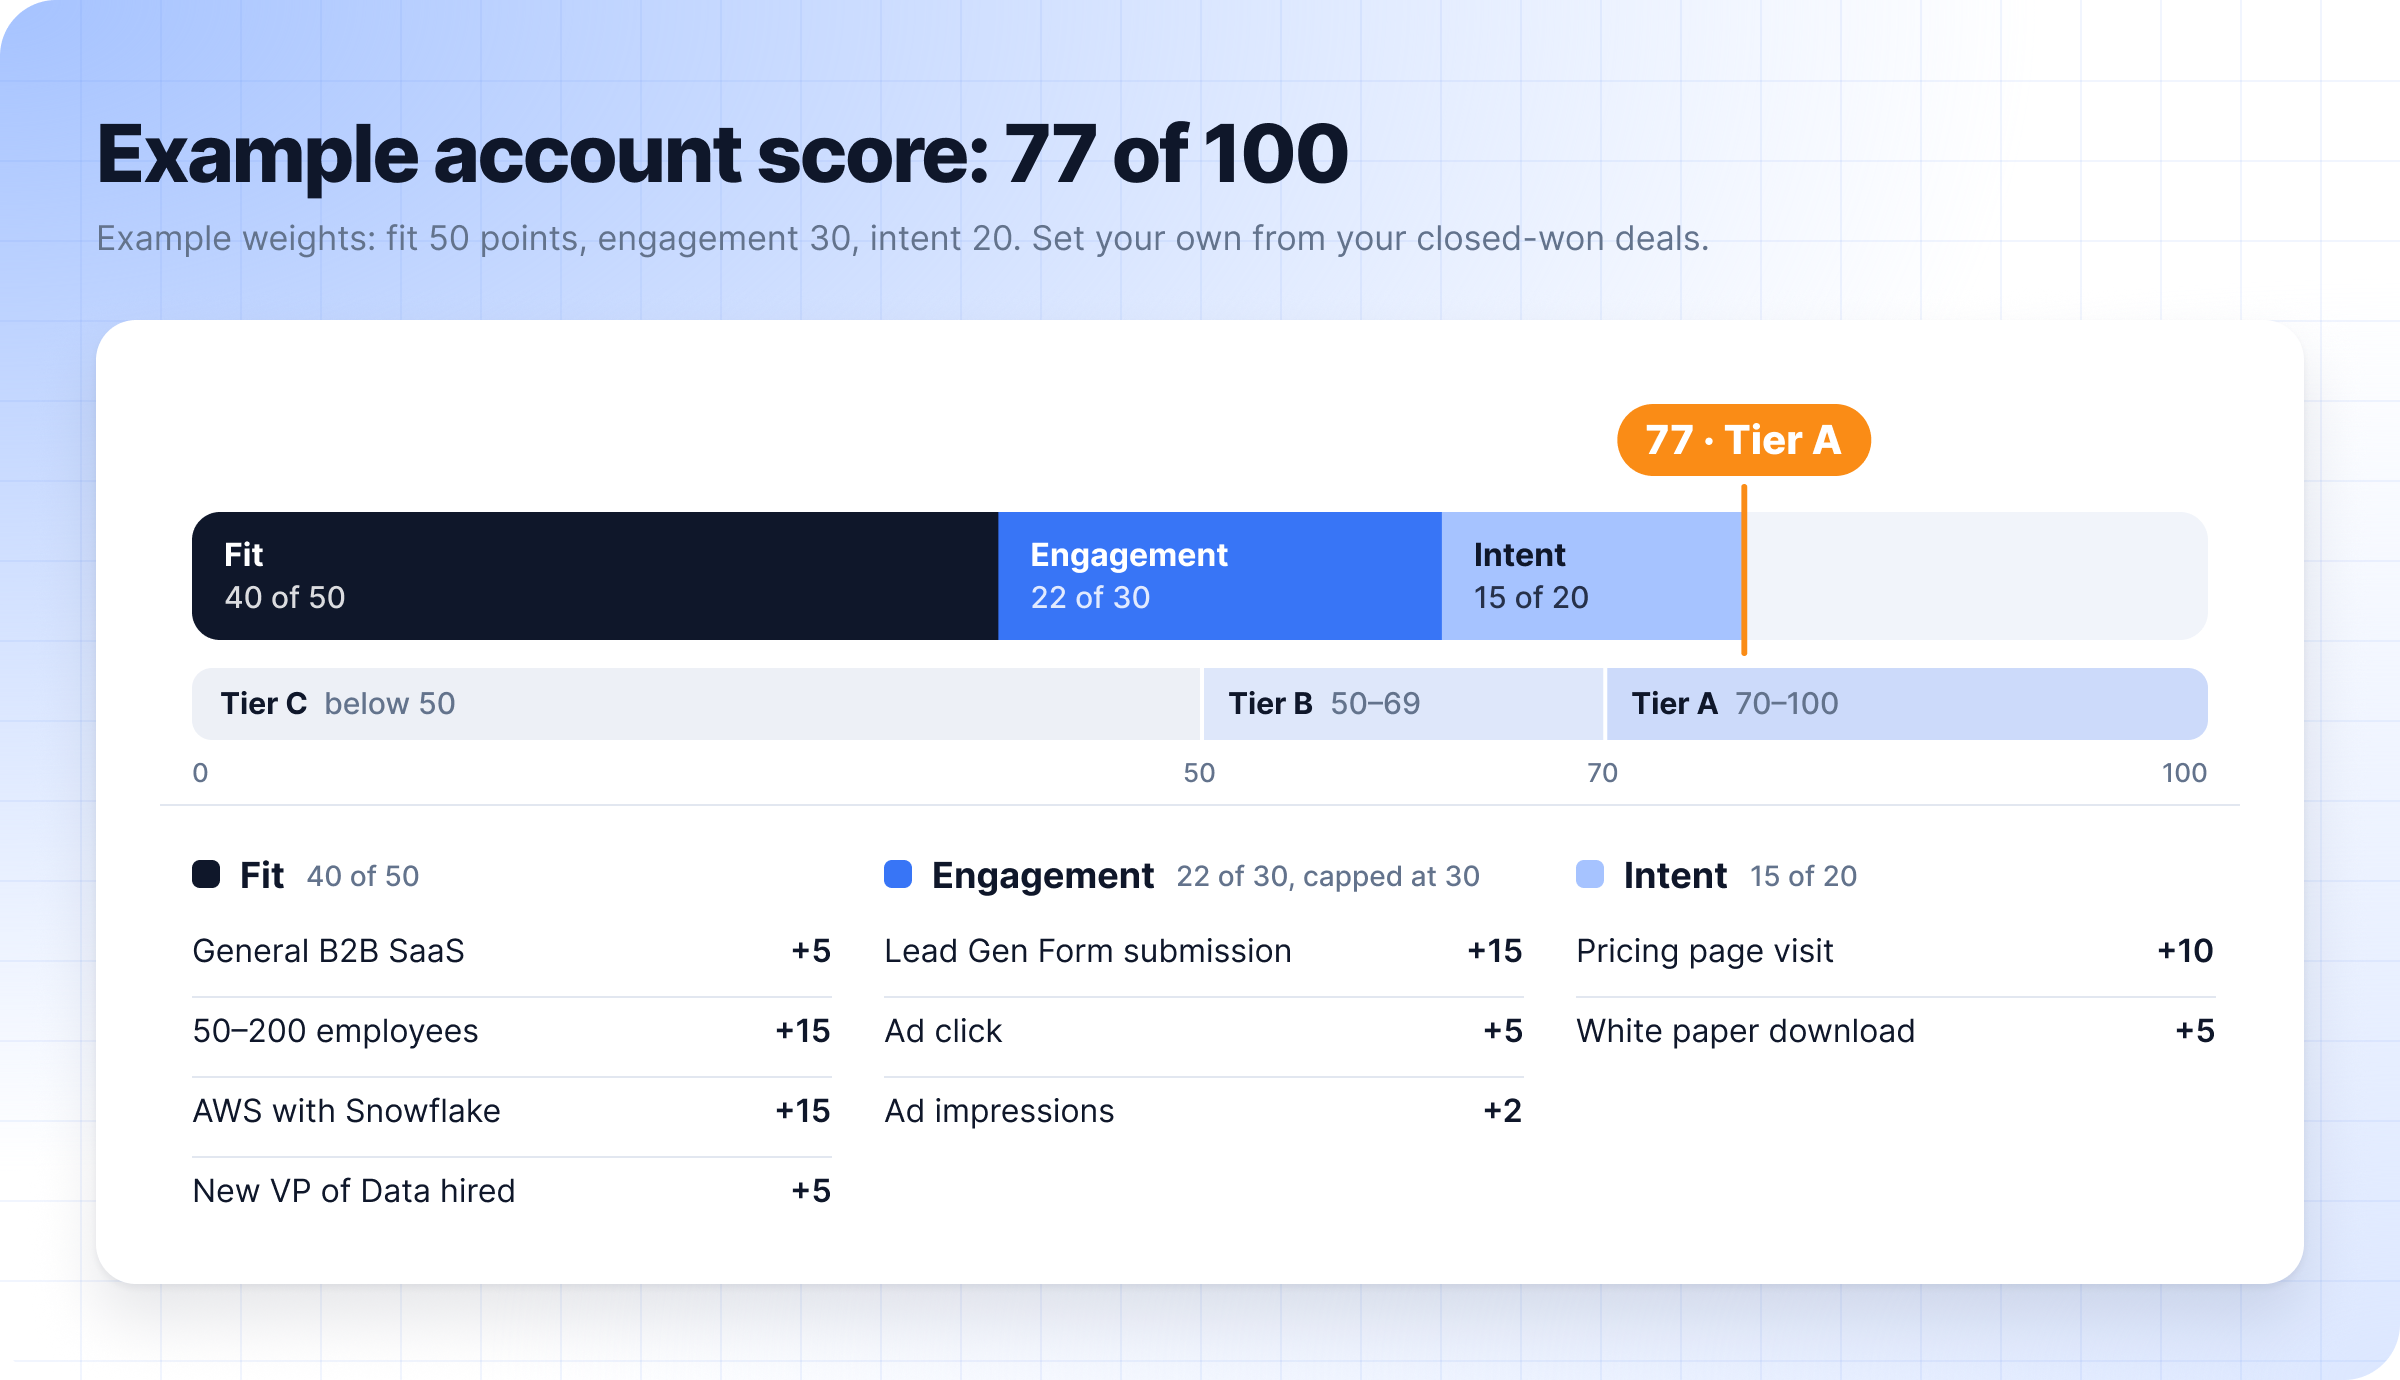
The scorecard (example): out of 100 points, fit is worth 50, engagement 30 and intent 20. Intent could be scored as 10 points for a pricing page visit, 20 for three visits in a week, and 5 for a white paper download, capped at 20.
Say an account scores 40 on fit, 22 on engagement from ad impressions, an ad click and one Lead Gen Form submission, and 15 on intent from a pricing page visit and a white paper download. That’s 77 points. The tiers could be:
These thresholds are yours to set, based on your own data.
You can make a company list for each tier and run each one in its own ad set, using the lists to build LinkedIn custom audiences. LinkedIn takes a company list of at least 300 rows and up to 300,000 companies. A new list can take up to 48 hours to build, and it expires if it isn’t used in an active or draft ad set for 90 days.
Check the score against outcomes:
Review closed-won and closed-lost deals by the score they had before the deal. Then adjust the weights, add decay, repeat each quarter, and keep a log of what you changed.
A marketing automation platform or your CRM can recalculate scores as new data comes in. Some tools also use past deals to estimate which accounts are likely to enter the pipeline, the idea behind predictive attribution.
There are four common account scoring models you can build on LinkedIn data:
| Model | How It Works | LinkedIn-Based Example | Best For |
|---|---|---|---|
| Point-based (additive) | Assigns fixed points to each signal and adds them up | 15 for a Lead Gen Form submission, 5 for an ad click | Teams starting out, who need a score sales can read at a glance |
| Weighted formula | Scores fit, engagement and intent separately, then weights each by how much it matters to the business | Fit 50%, engagement 30%, intent 20% | Teams that know which input predicts deals best |
| Tiered model | Groups accounts by score so high-priority accounts surface for follow-up | Tier A gets a demo offer, Tier B retargeting, Tier C is monitored | B2B teams running ABM campaigns with complex sales cycles |
| Predictive or machine learning | Learns from past deals which signals came before a win, and scores new accounts on that | Finds which mix of LinkedIn engagement, site visits and fit preceded closed-won deals | Teams with enough closed-won history to learn from |
The right scoring model depends on your goals, resources, data and sales cycle.
For your account scoring model to work well in practice, three habits help.
Rules are transparent and easy to explain to sales. Machine learning finds patterns people miss, but it needs volume and clean data, so a small team with few closed deals should start with rules.
AI is useful in between, for questioning the data to set and test weights. The DemandSense MCP server lets you ask Claude or ChatGPT about LinkedIn ad engagement, identified website visitors and CRM state side by side, in plain English. For example: “Which ICP-fit companies saw our ads, visited the site, and aren’t in our CRM yet?” DemandSense answers questions about your data and leaves the scoring to you. If Claude is your tool, here’s how to analyze LinkedIn ads with Claude.
Route on both lead and account scores: a named lead from a Tier A account goes straight to sales; a named lead from a Tier C account goes to nurture.
This works alongside your MQL vs. SQL definitions. The lead score says whether a person is qualified, and the account score decides which qualified leads get worked first. Agree on response times per tier before you launch the workflow.
Write one clear definition of each tier, and use the same tiers in the CRM, your LinkedIn audiences and sales views.
Markets and buyer behavior shift, so a model that worked last year can drift. Review it quarterly with sales, let reps flag accounts the model got wrong, and use those flags to retune it.
To know whether your scoring model works, track a few account-level metrics by tier:
Higher tiers should produce more pipeline. If they don’t, the weights are wrong.
DemandSense is a platform for the marketer who runs LinkedIn Ads in a small B2B team. It puts three things in one place that usually live in three separate tools: attribution, optimization, and website visitor profiling. On top of that sits an MCP server.
A scoring model is only as good as its engagement data and its check against pipeline. DemandSense Revenue Attribution covers both:
DemandSense also identifies the companies visiting your website, and the people on US traffic, and scores each identified visitor on fit and engagement using rules you write. Those scores cover website visitors only, and they decay when a visitor goes quiet.
Start your 30-day free trial at demandsense.com, no card needed.
Update scores as new engagement comes in, and let points decay. Review the weights each quarter against closed-won and closed-lost deals, and sooner after a change in your product or market.
Yes. Both CRMs can hold a score on the company or account record. The LinkedIn half gets there through Lead Gen Form syncs, CSV exports from the Companies view, or a tool that reads LinkedIn engagement next to the CRM, such as DemandSense with HubSpot, Salesforce or Attio.
There’s no universal number. Look at how much engagement your won accounts had before an opportunity opened, and set the threshold there. Engagement only counts with fit, and breadth across roles matters more than volume.
Yes. Fit without engagement means the right company at the wrong time. Engagement without fit means the wrong company, such as students, competitors or job seekers. Score both, and tier on the combination.
Engagement is an account responding to your ads and posts, while intent is an account researching the problem or category, on your site or elsewhere. Engagement alone can be curiosity, so track buyer intent as well and weight both.
Cap the points one person can add, score distinct roles engaged, let points decay, and exclude your own employees, agencies and competitors. LinkedIn’s paid engagement is reported per company, so one very active person can lift a whole account’s numbers without you noticing.
Filed under
Written by
Content Lead, DemandSense
Kristina is a journalist by training with seven years of writing for B2B companies and more than a hundred marketing pages behind her. She leads content at DemandSense and edits everything published on this blog.
All articles by Kristina Haidai →LinkedIn Ads
What an MQL and an SQL are, how to qualify leads from LinkedIn Ads, and why lead quality, not lead volume, decides whether campaigns build pipeline.
LinkedIn Ads
The best alternatives to native LinkedIn targeting: Microsoft Advertising, Google Search, ABM platforms and more, and which one fits your goal.
LinkedIn Ads
Tools & Comparisons
Compare the best free LinkedIn tools for B2B marketing: competitor ad research, benchmarks, tracking and lead capture, and what each one gives you free.
Get expert insights and strategies delivered to your inbox weekly.
